Back in 1999 we looked at the analysis of complex data sets in the field of Ion Mobility Spectrometry (IMS). These were no classical multi-dimensional files such as you would find in time-elapsed spectroscopy or multi-dimensional Nuclear Magnetic Resonance Spectrometry—why?
Articles and Columns
Pages
During the last few decades, solution and solid state techniques have been utilised to obtain information about the properties of supramolecular host–guest complexes. Mass spectrometric analysis of these fragile non-covalent complexes has been focused on the determination of the molecular mass of the interacting molecules and the analysis has concentrated on the characterisation of covalent compounds. Since the invention of the soft ionisation techniques [namely ESI (electospray ionisation) and MALDI (matrix-assisted laser desorption/ionisation)] and their development for mass spectrometry (MS) instruments, the area and way that MS analysis is used have greatly changed and expanded. In particular, ESI has attained a steady position for the analysis of biomolecules, their non-covalent complexes and other rather fragile systems, which were earlier impossible to study by mass spectrometric methods. Today, MS can be employed not only for molecular weight identification purposes but also for sophisticated analyses on versatile properties of compounds. In the area of supramolecular chemistry, MS studies are becoming more and more general, although MS utilisation is still quite limited.
Over the last two decades therapeutic antibodies have become the fastest growing area in pharmaceutical biotechnology. The medical significance of these therapeutic entities is highlighted by the commercial availability of about 20 products on the market with more than 160 candidates evaluated in different clinical trials. One reason for the success of antibodies as therapeutic agents is related to the large advancement in their biotechnological production via fermentation. Nowadays titers of about 4 g L–1 in 11-day fed-batch mode using the CHO BI HEX process are achievable using CHO-cells (CHO: chinese hamster ovary).
A.M.C. Daviesa and Tom Fearnb
aNorwich Near Infrared Consultancy, 75 Intwood Road, Cringleford, Norwich NR4 6AA, UK. E-mail: [email protected]
bDepartment of Statistical Science, University College London, Gower Street, London WC1E 6BT, UK. E-mail: [email protected]
Peter J. Jenks
the Jenks Partnership, Newhaven House, Junction Road, Alderbury, Salisbury, Wiltshire SP5 3AZ, UK
The ultimate use of XRF for medical analysis is in vivo measurements made directly in the living patient or volunteer. It started with quantitative analysis of iodine in the human thyroid. The idea sprang from the pioneering work by Jacobsson, who developed a technique for subtraction radiology of iodine using two x-ray energies, one above and one below the K-absorption edge of iodine. Hoffer et al. realised that if that technology worked, there should be a chance to see the emitted characteristic x-rays from iodine using the semiconductor detectors, which at that time had been developed for nuclear and particle physics. In this way the first in vivo XRF analysis was done, quantifying the iodine concentration in human thyroid, typically around 400 µg g–1. The further development of the in vivo XRF technique was related to the analysis of heavy elements, first covering lead and later cadmium and to some extent also mercury in occupationally exposed workers. Platinum was also analysed to investigate uptake and kinetics of the cytostatic agent cis-platinum in tumour patients. The following section describes efforts made to study various toxic elements in vivo in occupationally exposed workers and in patients.
This article will demonstrate the use of Raman spectroscopy as a fast and easy detection system for different counterfeit erectile dysfunction drugs. The possible counterfeits analysed consisted of two Viagra® tablets, SEYAGRA-GEL containing the same active ingredient as Viagra® and two tablets claiming to contain the same active ingredient as Cialis®.
An Interview with Martin Gerlach discussing the Bayer Technology Services (BTS) Process Analysis approach.
In the first of our new Quality Matters columns (Issue 20/1), I introduced the new team of contributors and mentioned that John Hammond would be writing, from his position as the UK Industrial Delegate to the ISO-REMCO Committee, about the workings of that important body and looking to the future following some important decisions taken at the June 2007 meeting in Japan. This is his first of what will be a regular series of reports on the workings of REMCO.
A.M.C. Davies and Tom Fearn
Norwich Near Infrared Consultancy, 75 Intwood Road, Cringleford, Norwich NR4 6AA, UK. E-mail: [email protected]
Department of Statistical Science, University College London, Gower Street, London WC1E 6BT, UK. E-mail: [email protected]
The effectiveness of these new reagents in quantitating eight states simultaneously has been determined against a set of known peptides and proteins, and is outlined in this article. The reagents were evaluated for label efficiency, fragmentation efficiency and precision and accuracy of quantitation.
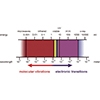
Since the first experiment was performed nearly a decade ago, ultrafast two-dimensional infrared (2D-IR) spectroscopy has emerged as an exciting non-linear ultrafast laser technique for probing molecular structure and solute–solvent interaction dynamics in a range of systems of chemical and biological relevance.

Analysis of used lubrication oil for metals is commonplace in many industries. The metals analysed fall into three categories: wear metals, contaminants and additive elements. The concentration of these metals and elements can then be interpreted to schedule maintenance of engines and machinery such as construction machinery and aeroplanes. The cost of unscheduled maintenance can be high, not only in materials and parts, but also in lost profits due to downtime. Once the oil has been sampled, Inductively Coupled Plasma Optical Emission Spectroscopy (ICP-OES) analysis is a very useful tool for this application.
(Image courtesy Shell Motorsport)
There has been much debate about which program can predict NMR spectra the best. It is well known within the NMR community that spectra prediction strongly depends on the “quality” of the starting data sets for those systems which use real data as a knowledge base. It has become a hot topic in some blogs, although disappointingly most of the authors tend to have affiliations to one software vendor or another.
One of the dangerous kinds of pollution in aquatic systems is due to the dumping of materials containing heavy metals. Hence, the monitoring of heavy metals in aqueous samples is becoming increasingly important. Normally, metal concentrations in water are in the ng L–1 range, and the analytical procedures used for their determination are usually based on Anodic Stripping Voltametry (ASV) and Atomic Spectrometry, including Electrothermal Atomic Absorption Spectrometry (ETAAS), Inductively Coupled Plasma Atomic Emission Spectrometry (ICP-AES) and Inductively Coupled Plasma Mass Spectrometry (ICP-MS). However, the direct analysis of some complex environmental samples like seawater presents some difficulties, mainly due to the high salinity of the matrix. Therefore, in such cases, a dilution of the sample may be necessary before the analysis, or a preliminary separation and/or preconcentration step may be required to eliminate interferences and/or to improve detection limits for metals in the low µg L–1 range. Moreover, when the analysis is performed by using solid sorbents followed by spectrophotometric techniques, an additional elution step after the preconcentration procedure is necessary to recover the species in an appropriate medium.
In the final RM Column, I concluded with the words “To cover this enhanced scope the editorial team will expand: there will be a couple of new names joining me in the preparation of the new column”. In this, the very first Spectroscopy Europe Quality Matters Column, I’m delighted to be able to announce our new columnists as Christopher Burgess and John Hammond.

A brief history and personal recollection of the development of magnetic resonance imaging (MRI).
This is the 34th RM Column and over the last seven years we have looked at reference materials (RMs) from just about every possible angle and re-visited some topics more than once. Whilst we have focussed mainly on RMs, over time there has been a change in the way RMs are used and their importance to analytical laboratories.
The starting point for this column is the last one from last year! In that column TD began what was intended to be a two-part story but has, with this column, become a story in four parts. There were required topics we had not covered and we need to begin this column by completing the discussion of removing multiplicative effects by describing what the two most popular methods do to NIR spectra.
Thin polymer layers on solid substrates are of high technological importance due to their increasing potential for applications in electronics, sensors, nanotechnology and biotechnology. Appropriate characterisation methods are necessary for the design and analysis of devices made using such materials. This review article focuses upon presenting the many analytical possibilities for quantitative evaluation of the optical constants and thickness of polymer layers by combined application of spectroscopic ellipsometry (SE) in the visible (vis) and infrared (IR) spectral range.