Antony Neil Daviesa and Jörg Ingo Baumbachb
aExternal Professor, University of Glamorgan, UK. Director, ALIS Ltd, and ALIS GmbH–Analytical Laboratory Informatics Solutions
bISAS–Institute for Analytical Sciences, Metabolomics Department, Bunsen-Kirchhoff-Str. 11, 44139 Dortmund, Germany
Background
Back in 1999 we looked at the analysis of complex data sets in the field of Ion Mobility Spectrometry (IMS).1 These were no classical multi-dimensional files such as you would find in time-elapsed spectroscopy or multi-dimensional Nuclear Magnetic Resonance Spectrometry—why? Well for one the intensities in the various dimensions can actually affect the signals observed in the other dimensions. This is due to the competitive nature of the signal generation in IMS. Also the most intense signal often observed has no real direct value in the normal data analysis—rather like the Rayleigh scattering in a Raman spectrum (see Figure 1). As the signals often come from multiply-ionised clusters they may repeat at different times in the spectrum but as the shape of the cluster also plays a role in the drift time they may well not be simple multiples of the charge carried as you would find in, for example, Mass Spectrometry of proteins or other very large molecules. Finally, the process of generating the charge-carrying species also changes with ionisation source and a large number of other experimental parameters highlighted in 2006.2
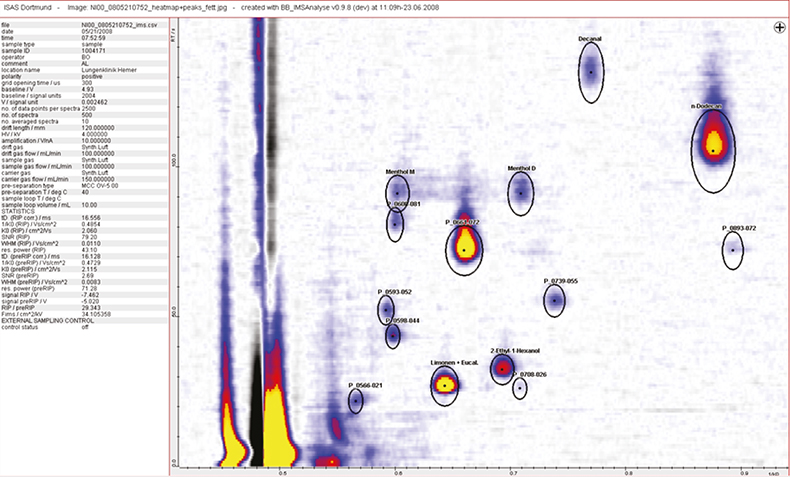
Figure 1. A small section of a typical data set observed during the clinical trials, the complete spectrum contains 400–600 different peaks.
So one of the first steps in understanding the complex signals observed has been to run a high-resolution laboratory-based experiment in parallel and compare the measurements with reference data. In this case the multi-capillary column used for the preliminary species separation is used as a pre-column for a standard GC/MS.
Developments and awards
In the 2006 article, preliminary results were shown for clinical diagnostic support, looking at the effectiveness of this IMS technology intimately coupled with the data treatment approaches we had described in 1999. Well I am very pleased to say that the progression of PhD and research students has stuck valiantly to their tasks gathering more data and checking on the robustness and reproducibility of the hardware and data analysis software.
In Figure 2 you can see some of the problems associated with the technology with differences appearing in the absolute signal position as well as the relative drift times as the run progresses. The top-left figure shows a region in the data set where key substances involved in the diagnosis support are located. Their expected locations are indicated by the black ovals. In order to carry out reproducible data analysis the inter-run differences need to be quantified and automatically corrected as can be seen in the lower-left trace. The two right-hand traces show the effect of getting this alignment wrong. The graphics show four columns from over 400 leading diagnostic signals and the rows are individual patient analytical runs. In the top-right representation the data analysis is just about acceptable, with the substance peaks falling within the boxes but as more runs are carried out the signals can be seen to drift outside the analytical regions, whereas in the bottom trace the shift in the analytical signals has been compensated for and the signals to be assessed all lie within their expected boxes.
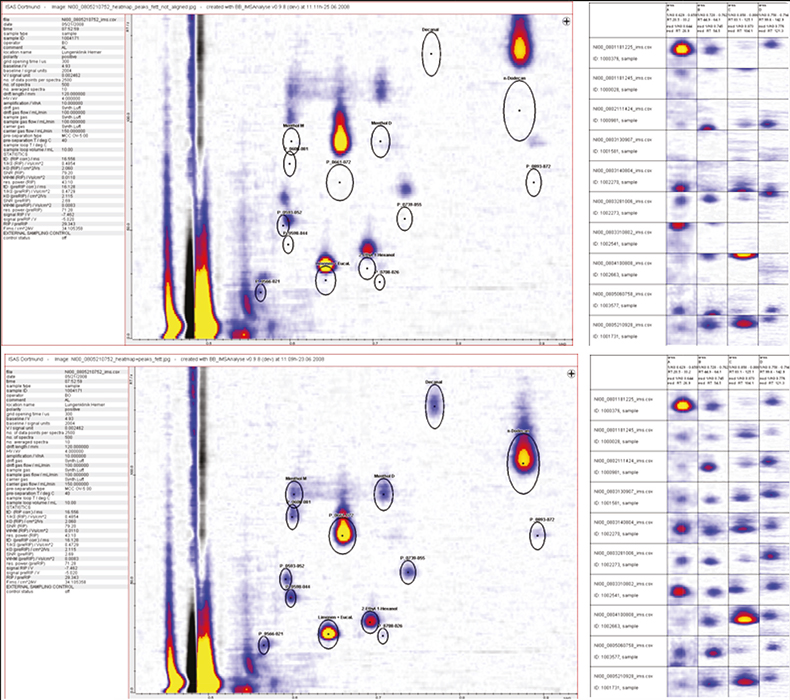
Figure 2. A small region of the analytical data on the left-hand side with the expected peak locations shown as black ovals. In the top figure the drift in the chromatography can be clearly seen. The two right-hand graphics show the effect of not compensating for this drift with the columns representing various analyte signals and the rows different patients in the trials.
Such has been their success that the project was awarded the prestigious Science Prize of the German Association of Pneumologists. Why is this development important—well lung cancer is very difficult to spot in the early stages of the development of the disease. The survival rates for lung cancer are only around 15% in comparison to 50% for other cancers. Lung cancer patients often display no symptoms until the disease has progressed to an advanced stage where a successful outcome to any treatment is significantly more difficult to achieve. So any system which can help diagnose the disease at a more-treatable early stage—especially if it can work in a non-invasive mode—would be very desirable.
Data handling
Ion mobility spectrometry itself is inherently low resolution, carrying out ionisation and ion-species drift measurements at atmospheric pressure. Also many of the species needed for diagnostic support are only present in very low quantities so robust data pre-processing is essential to the evaluation stage. Figure 3 shows the selected pre-treatments in action. The left-hand data shows clearly the level of noise on the raw data. First, a discrete wavelet transformation is applied which clearly assists in emphasising the true signals within the data set as shown in the middle graphic and finally an additional noise reduction step using log normal detailing yields the much cleaner data shown in the final graphic.
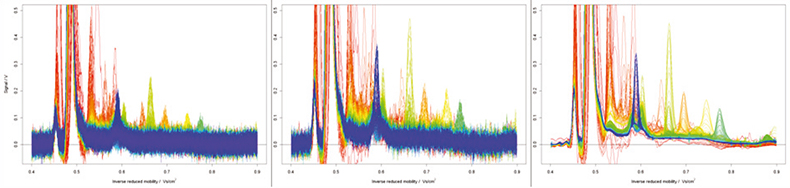
Figure 3. A raw data file (left), the file following wavelet smoothing (middle) and log-normal detailing noise reduction (right).
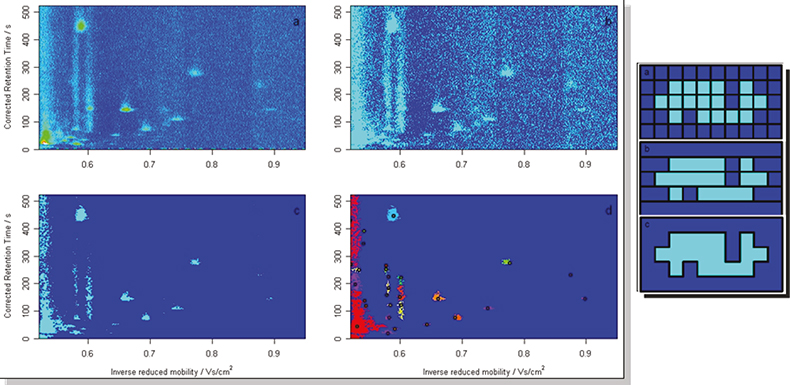
Figure 4. One approach has been merged peak cluster localisation.
Clearly in order to make a functioning clinical diagnostic support instrument the analytical signal evaluation of these complex matrices must be capable of being made by the software as no ion mobility spectroscopists will be around to help the lung specialists with their diagnoses! With the noise reduced, the next data processing requirement was for an improvement in the identification of the individual components within the matrices alongside a greater robustness against noise being flagged as false signals.
Here the different dimensions are treated independently with a box analysis technique looking at the data in sections and then analysing each neighbour in turn to see if other traces of a possible peak are present.3 They effect can be quite dramatic and the reduced data volume following the treatment is much better suited for disease fingerprinting as the original raw data can have around a million data points which we can reduce to several hundred unique identifiers for each dataset.
Diagnostic support
So we now have a method of generating robust reproducible data, how do we convert this into a simple statement of information on possible disease indicators? Discriminant analysis techniques applied to the reduced data have proven successful in assisting lung cancer diagnosis (see Figure 5) with the combination of specific markers being found to be symptomatic of the presence of the disease.
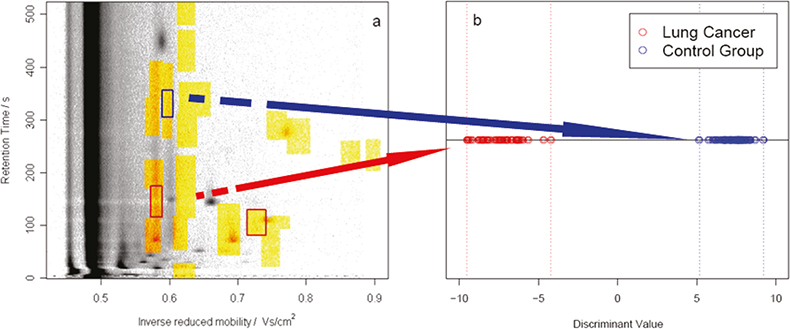
Figure 5. Discriminant analysis of the reduced data can assist lung cancer diagnosis. X marks the spot a patient with early-stage lung cancer was identified correctly (carcinoma in situ).
This is a major success when carrying out clinical studies amongst populations already diagnosed with the disease because of the simplicity of the non-intrusive IMS method. However, the real achievement is shown in Figure 5 where the first successful early-stage lung cancer diagnosis is shown for a trials patient expected to be in the control group.
Finally, although the headline grabber is the lung cancer diagnostics this technique is equally applicable to any disease where markers can be found in exhaled breath. For a reliable diagnosis and separation of lung cancer from other disorders further measurements and an evaluation of the discriminating pattern in a larger group of patients are necessary.
Acknowledgements
Dr Sabine Bader worked long and hard on the pre-treatment requirements as well as the nest techniques for analyte peak recognition. Mr Bertram Bödeker carried out the data-set alignment studies as well as the automated analysis programming. This study would have remained a theoretical academic exercise were it not for the active support of Dr Michael Westhoff at the Lungenklinik Hemer. And last but not least nothing would happen without funding and this has been provided by the EU-Project BAMOD, the state of North-Rhine Westfalia and the Federal German government.
References
- A.N. Davies and J.I. Baumbach, Spectrosc. Europe 11(5), 23–24 (1999).
- J. I. Baumbach and M. Westhoff, Spectrosc. Europe 18(6), 22–27 (2006). https://www.spectroscopyeurope.com/article/ion-mobility-spectrometry-detect-lung-cancer-and-airway-infections.
- S. Bader, W. Urfer and J.I. Baumbach, J. Chemometrics 20(4), 128–135 (2007). https://doi.org/10.1002/cem.998.
- S. Bader, W. Urfer and J.I. Baumbach, Int. J. Ion Mobil. Spectrom. 11, in press (2008), https://doi.org/10.1007/s12127-008-0005-6.