Neil T. Hunt
Department of Physics, University of Strathclyde, SUPA, 107 Rottenrow East, Glasgow, G4 0NG, UK. E-mail: [email protected], http://bcp.phys.strath.ac.uk/ultrafast/
Since the first experiment was performed nearly a decade ago,1 ultrafast two-dimensional infrared (2D-IR) spectroscopy has emerged as an exciting non-linear ultrafast laser technique for probing molecular structure and solute–solvent interaction dynamics in a range of systems of chemical and biological relevance. Additionally, the unique combination of structural information and ultrafast time resolution allows 2D-IR spectroscopy to probe non-equilibrium and even reacting systems, effectively making real-time movies of molecular processes. This article provides a brief introduction to the experimental methodologies behind ultrafast 2D-IR spectroscopy before using applications to illustrate the additional information afforded by this new approach.
While linear (1D) infrared spectroscopy is a powerful probe of molecular structure and of the solute–solvent environment, much of this information is lost because we obtain an ensemble-averaged response projected onto one frequency axis causing information relating to vibrational coupling and structural fluctuations to be unrecoverable. 2D-IR circumvents this, spreading the molecular response over two frequency axes to produce a spectrum not unlike that obtained via 2D-nuclear magnetic resonance (2D-NMR) spectroscopy, in which the 1D spectrum is present along the spectrum diagonal with cross- or off-diagonal peaks revealing vibrational coupling between the individual modes of the studied molecule. These cross-peaks yield much of the new information available from 2D-IR, including molecular structural information through the angles between coupled transition dipole moments and vibrational energy relaxation mechanisms through the ability to observe energy flow between vibrational modes. Additionally, the lineshapes obtained by 2D-IR methods give insight into solute–solvent dynamics and inhomogeneous broadening effects, while the rates of chemical exchange processes between hydrogen-bonded species can also be measured. It is not possible to mention every application of 2D-IR individually but the technique has been the topic of excellent recent review articles.2,3
There are two experimental approaches to recording ultrafast 2D-IR spectra, the quasi-frequency domain double resonance approach4 and the time domain vibrational echo method.5 Both employ a series of short-duration (100fs) infrared laser pulses tuned to resonate with the vibrational modes of interest. It has been shown that both methods rely upon the same third order molecular response function and yield the same peaks, with both having advantages and disadvantages. Double resonance, being based upon a narrowband pump-broadband probe optical geometry, is experimentally more straightforward and faster to perform, requiring less complex manipulation of the acquired data, while vibrational echo 2D-IR, which uses a train of three pulses to generate an echo signal analogous to NMR methods, yields greater spectral and temporal resolution and greater control over the experimental parameters.4
A basic introduction to 2D-IR spectroscopy both in terms of the differences with respect to Fourier transform infrared (FT-IR) spectroscopy and the peak assignments of a 2D spectrum can be given with reference to Figure 1. The molecular structure and a diagram of the relevant vibrational energy levels of acetylacetonato-rhodiumdicarbonyl (RDC), which has been widely studied using 2D-IR4,5 are shown in Figure 1(a) and (b), respectively. Figure 1(c) shows the FT-IR spectrum of RDC dissolved in heptane; the antisymmetric (a) and symmetric (s) stretching modes can be seen at 2015cm–1 and 2084cm–1, respectively. Comparison of this spectrum with the 2D-IR spectrum [Figure 1(d)] clearly shows the increased numbers of peaks, and therefore information, contained within the 2D-IR spectrum. Using double resonance terminology for simplicity, the experiment is performed by scanning the pump frequency (left-hand axis) across the laser bandwidth (typically 200cm–1) in narrow-band sections of 10cm–1. Wavelength selection is achieved using a Fabry–Perot filter or pulse-shaping device. The broadband IR probe pulse is spatially overlapped with the pump beam in the sample after a given time delay and subsequently dispersed in a spectrometer prior to recording using an array detector. The pump pulse train is modulated at half the laser pulse-repetition rate using a chopper such that a 2D-IR spectrum is comprised of a stack of pump-probe type difference spectra as the pump wavelength is scanned. The peak assignments can be made from the energy level diagram [Figure 1(b)]. For a pump wavelength coinciding with the 0-a transition at 2015cm–1, the pump-probe spectrum shows a negative peak at 2015cm–1 and a positive peak at 2001cm–1 arising from the bleach/stimulated emission from the 0-a transition and the transient absorption of the a-2a transition, respectively. These give rise to the pair of diagonal peaks near (pump, probe) = (2015, 2015) in Figure 1(d). The 2D-IR spectrum also shows a positive–negative pair of off-diagonal peaks near (2015, 2084). These indicate that the two carbonyl transitions are vibrationally coupled and hence share a common ground state. Thus, exciting the 0-a transition also leads to a bleach of the 0-s transition (negative peak). The positive off-diagonal peak near (2015, 2060) arises from population of the 0-a mode and is a transient absorption (a-as) transition to the as combination band. As the pump-probe delay time in Figure 1(d) was short (2ps), there has been no population transfer from the a to the s level and so no transient absorption peaks originating from the s level are observed for this pump wavelength. If a pump-probe delay time of 10ps were used, however, the a and s populations have time to equilibrate and extra positive peaks due to the s-2s and s-as transitions are observed. Thus, by using a train of pulses, 2D-IR yields extra peaks, giving extra information on the chosen system via access to vibrationally excited states outwith the reach of 1D methods alongside vibrational energy redistribution data.
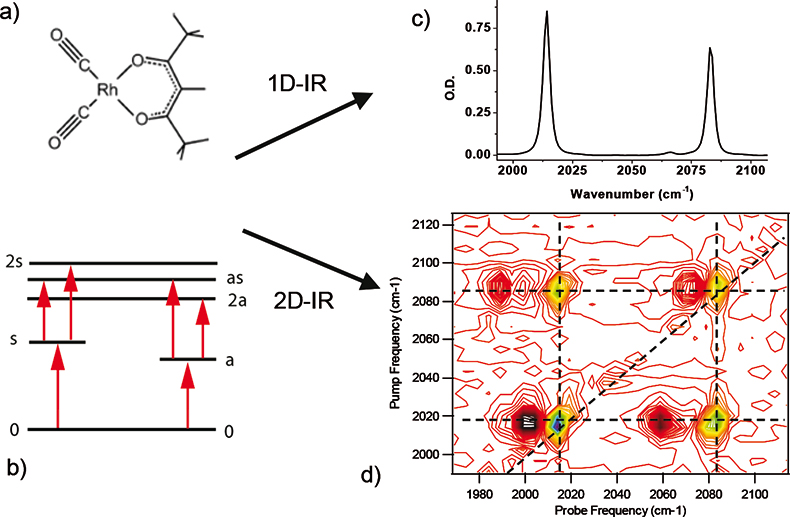
Figure 1. (a) Molecular structure of RDC. (b) Vibrational energy level diagram for the CO stretching modes of RDC. (c) FT-IR spectrum of 5 mM RDC in heptane. (d) 2D-IR spectrum of 5 mM RDC/heptane recorded using the double-resonance method and a pump-probe delay time of 2 ps.
While the above example is effective for giving an overview of 2D-IR spectra, it is instructive to consider the current state of the art in order to illustrate the capabilities of the technique. One application of ultrafast 2D-IR is as an analytical tool, in a similar manner to that of 2D-NMR, where cross peaks and couplings are used to determine molecular structures. By recording a 2D-IR spectrum of either a mixture of compounds or of a species with a complex IR spectrum, the use of cross peaks can be used to determine which peaks belong to the individual components of a mixture, or information on vibrational couplings can be used to help assign complex spectra. An example of the use of 2D-IR cross-peaks to separate lines due to a mixture of two carbonyl species has been reported.6
A major application of ultrafast 2D-IR spectroscopy has been to the study of peptide systems. The 1D spectral response in the amide I region, which is sensitive to peptide secondary structure, can often be broad and featureless, but applying 2D techniques reveals new information relating to structure and dynamics. Examples have included the determination of solution-phase structure of small peptide molecules,7 which is achieved by studying the dependence upon input polarisation of the infrared laser pulses of the off-diagonal peaks. This yields information relating to the angle between the coupled vibrational transition dipole moments. In the case of the amide I band, these lie close to the C=O bond direction giving direct structural insight. Studies of larger systems have also been carried out, including the use of 2D-IR spectroscopy to study the macroscopic 2D-IR pattern attributable to a given secondary structure motif.8 Combination of 2D-IR methods with isotopic labelling has also facilitated determination of the presence of vibrational interaction via hydrogen bonding and angle between two transmembrane peptide sequences.9 Structural and vibrational dynamical aspects of DNA base pairs have also been studied.10 The relationship between 2D-IR experiment and theory is seen in the application of 2D-IR to peptide systems, where the complex patterns in the off-diagonal region require the combination of experimental and theoretical approaches to extract the maximum information from 2D-IR.
Another application of 2D-IR spectroscopy lies in the ability to determine, and remove, effects due to inhomogeneous spectral broadening. This is important in the case of hydrogen-bonded solutions and it is possible to use 2D-IR spectroscopy to gain insight into the rates of solute–solvent interaction dynamics. This is illustrated using Figure 2,11 similar effects have also been reported in work on water and related systems.12,13
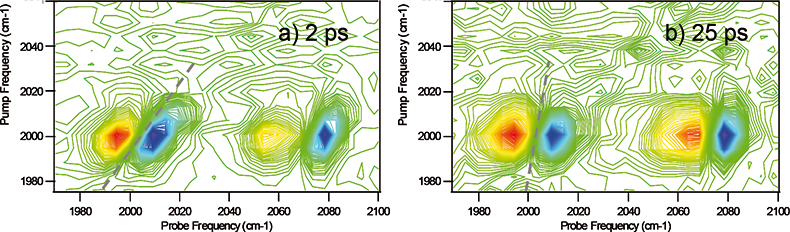
Figure 2. 2D-IR spectrum of 5 mM RDC in 1,7 heptanediol at 80°C.11 Spectra were recorded using the double resonance method with pump-probe delay times of a) 2 ps and b) 25 ps.
Figure 2 shows the 2D-IR spectrum of RDC dissolved in 1,7-heptanediol. Via FT-IR, significantly inhomogeneously broadened lineshapes for the carbonyl stretches are observed due to hydrogen bonding. A comparison of Figures 2(a) and (b) shows that as the pump-probe time delay (waiting time when using vibrational echo terminology) is increased the 2D lineshape evolves from diagonally elongated toward a circular profile. An alternative measurement is to note the rotation of the nodal plane between the positive and negative peaks from diagonal toward vertical with increased pump-probe time delay (see dashed lines). This effect is indicative of inhomogeneous broadening. In a dynamic system such as this, each member of the ensemble is continually evolving in terms of hydrogen bonding environment and thus transition frequency. If the pump-probe delay time is short with respect to this timescale, then no spectral diffusion has occurred and the ensemble has not experienced other environments before it is measured by the probe pulse. Hence the line is broad, but only along the diagonal. At longer times, spectral diffusion is complete and each member of the ensemble has experienced all other environments, leading to an averaged, circular 2D lineshape. By monitoring the temporal evolution of the lineshape, it is thus possible to determine the timescale for the interactions that lead to inhomogeneous broadening.
In addition to analysing 2D-IR lineshapes, solute–solvent interactions can be probed via 2D-IR exchange spectroscopy. Here the interchange rate between two species in dynamic equilibrium can be measured through the growth of off-diagonal peaks as a function of the pump-probe delay time. This approach was first applied to the peptide model compound N-methylacetamide14 but for illustration purposes, consider the system of benzene and phenol (deuterated) dissolved in carbon tetrachloride.15 In this case, the FT-IR spectrum in the O–D stretching region shows two peaks, a high frequency peak due to free phenol and a red-shifted band corresponding to the hydrogen-bonded phenol–benzene complex. As with all H-bonded systems, these species are continually interchanging but it has thus far been impossible to measure the process directly. 2D-IR spectroscopy (Figure 3) of this system at short pump-probe delay times [Figure 3(a)] reveals two diagonal resonances (ignoring any contributions from the v=1–2 transitions which show identical dynamics), one from each of the phenol environments. No cross-peaks are observed because the diagonal peaks arise from different species with no vibrational coupling.
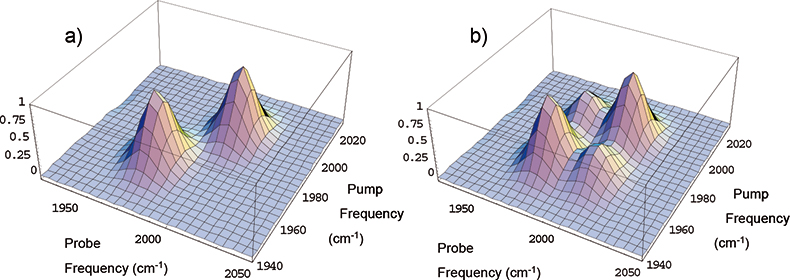
Figure 3. Schematic diagram of the results of a 2D-IR exchange spectroscopy experiment. (a) At short pump-probe time delays the spectrum shows the two diagonal peaks arising from the two exchanging components while at longer delays (b) cross-peaks arise indicating the presence of exchange processes. Note: only peaks corresponding to transitions originating in the ground state are shown for clarity—these have been represented as positive-going peaks for the same reason.
As the pump-probe delay time lengthens toward the tens of picoseconds range, cross-peaks grow into the spectrum [Figure 3(b)]. These arise from species which, when pumped, are in one environment, e.g. a complex, but in the time between the arrival of pump and probe pulses have dissociated to yield a free phenol molecule. Similarly, the other cross-peak arises from the reverse complex-formation process. Monitoring the rise-time of the cross-peaks allows determination of the rate of exchange within the system at equilibrium.15
While much of the current literature relating to 2D-IR measures equilibrium systems such as those discussed, work has begun to exploit the potential of 2D-IR to go beyond equilibrium, probing chemically/structurally evolving species. This is normally achieved through the use of a pulse of UV/visible wavelengths to initiate a photochemical process and using 2D-IR as a time-delayed probe of the system. Varying the time delay between the initiation pulse and the 2D-IR experiment enables a “molecular movie” of the system to be obtained. This technique is somewhat in its infancy, but it has been successfully employed to study excited electronic state solvation dynamics,16 the unfolding/folding of peptides by exciting a photoactive linking group17,18 and temperature-jump experiments on protein systems.19 The results of these studies have given unique insights into the systems studied; particularly peptide folding processes and such experiments clearly represent the future of 2D-IR spectroscopy.
Acknowledgements
The author would like to acknowledge the Engineering and Physical Sciences Research Council (EPSRC) for the award of an Advanced Research Fellowship.
References
- P. Hamm, M. Lim and R.M. Hochstrasser, J. Phys. Chem. B 102, 6123 (1998). https://doi.org/10.1021/jp9813286
- I.J. Finkelstein, J.R. Zheng, H. Ishikawa, S. Kim, K. Kwak and M.D. Fayer, Phys. Chem. Chem. Phys. 9, 1533 (2007). https://doi.org/10.1039/b618158a
- J. Bredenbeck, J. Helbing, C. Kolano and P. Hamm, Chem. Phys. Chem. 8, 1747 (2007). https://doi.org/10.1002/cphc.200700148
- V. Cervetto, J. Helbing, J. Bredenbeck and P. Hamm, J. Chem. Phys. 121, 5935 (2004). https://doi.org/10.1063/1.1778163
- M. Khalil, N. Demirdoven and A. Tokmakoff, J. Phys. Chem. A 107, 5258 (2003). https://doi.org/10.1021/jp0219247
- J.B. Asbury, T. Steinel and M.D. Fayer, Chem. Phys. Lett. 381, 139 (2003). https://doi.org/10.1016/j.cplett.2003.09.113
- Y.S. Kim, J. Wang and R.M. Hochstrasser, J. Phys. Chem. B 109, 7511 (2005). https://doi.org/10.1021/jp044989d
- A.W. Smith, C.M. Cheatum, H.S. Chung, N. Demirdoven, M. Khalil, J. Knoester and A. Tokmakoff, Biophys. J. 86, 619A (2004). https://doi.org/10.1016/S0006-3495(04)74334-9
- C. Fang, A. Senes, L. Cristian, W.F. De Grado and R.M. Hochstrasser, Proc. Natl. Acad. Sci. USA 103, 16740 (2006). https://doi.org/10.1073/pnas.0608243103
- A.T. Krummel, P. Mukherjee and M.T. Zanni, J. Phys. Chem. B 107, 9165 (2003). https://doi.org/10.1021/jp035473h
- A.I. Stewart, I.P. Clark, P. Matousek, M. Towrie, A.W. Parker and N.T. Hunt, in preparation 2007.
- A. Tokmakoff, Science 317, 54 (2007). https://doi.org/10.1126/science.1144515
- S.T. Roberts, J.J. Loparo and A. Tokmakoff, J. Chem. Phys. 125, 084502 (2006). https://doi.org/10.1063/1.2232271
- S. Woutersen, Y. Mu, G. Stock and P. Hamm, Chem. Phys. 266, 137 (2001). https://doi.org/10.1016/S0301-0104(01)00224-5
- J.R. Zheng, K. Kwak, J.B. Asbury, X. Chen, I.R. Piletic and M.D. Fayer, Science 309, 1338 (2005). https://doi.org/10.1126/science.1116213
- J. Bredenbeck, J. Helbing and P. Hamm, Phys. Rev. Lett. 95, 083201 (2005). https://doi.org/10.1103/PhysRevLett.95.083201
- Kolano, J. Helbing, M. Kozinski, W. Sander and P. Hamm, Nature 444, 469 (2006). https://doi.org/10.1038/nature05352
- J. Bredenbeck, J. Helbing, J.R. Kumita, G.A. Woolley and P. Hamm, Proc. Natl. Acad. Sci. USA 102, 2379 (2005). https://doi.org/10.1073/pnas.0406948102
- H.S. Chung, M. Khalil, A.W. Smith, Z. Ganim and A. Tokmakoff, Proc. Natl. Acad. Sci. USA 102, 612 (2005). https://doi.org/10.1073/pnas.0408646102