Patrick Garidel
Boehringer Ingelheim Pharma GmbH & Co. KG, Process Science, Pharmaceutical Basic Development, D-88397 Biberach an der Riss, Germany. E-mail: [email protected]
Introduction
Over the last two decades therapeutic antibodies have become the fastest growing area in pharmaceutical biotechnology. The medical significance of these therapeutic entities is highlighted by the commercial availability of about 20 products on the market with more than 160 candidates evaluated in different clinical trials. One reason for the success of antibodies as therapeutic agents is related to the large advancement in their biotechnological production via fermentation.1 Nowadays titers of about 4 g L–1 in 11-day fed-batch mode using the CHO BI HEX process are achievable using CHO-cells (CHO: chinese hamster ovary).2
The first products launched on the market were lyophilised dosage forms, requiring a reconstitution step before medical application. One reason for this was a lack in knowledge to stabilise antibodies in a liquid form, because a number of factors have a negative impact on protein stability in solution. Furthermore, in order to avoid protein loss during the process, e.g. due to the formation of aggregates, it is important in the early development phase to be able to screen rapidly and identify buffer conditions that may have a stabilising effect and avoid protein aggregation. Currently, formulations have been developed allowing storage of antibodies in a liquid form for two to three years at 2–8°C.1
Compared to NCEs (new chemical entities) biologics are quite complex molecules and a number of methods are necessary to characterise their protein structure. Additionally in their early purification and pre-formulation development phase methods are required that utilise just very small amounts of proteins for the evaluation of solution conditions that allow the stabilisation of the protein. Fluorescence spectroscopy has the characteristics that may fulfil some relevant criteria for studying protein stability during the early development phase; these are: (i) being a very sensitive method, (ii) rapid, (iii) allowing the screening of a number of solution conditions, (iv) requiring minimal chemometric data analysis, and (v) having the potential for automation. Although fluorescence spectroscopy does not usually provide detailed structural information, as, for example, X-ray or nuclear magnetic resonance,3,4 the method has some potential applications in pharmaceutical biotechnology, because of its acute sensitivity to changes in the structural and dynamic properties of proteins due to solvent variations. A number of fluorescence spectroscopic experiments are available and can be carried out at different levels ranging from straightforward measurements of steady-state emission intensity to more or less sophisticated time-resolved experiments.5 The combination of various fluorescence observables obtained under time-resolved conditions, in particular, has increased dramatically the interpretation of fluorescence results.6 However, for the relative evaluation of solution conditions with regard to protein stability, intrinsic fluorescence spectroscopy is quite useful, especially when combined with a well-defined thermal protocol, in order to characterise the thermal conformational stability of proteins in solution as a function of their solution properties.
The application presented in this article is therefore focused on steady-state intrinsic tryptophan protein fluorescence (ITF). Applications using extrinsic fluorescence labels are not considered.7 The results from steady-state intrinisic tryptophan protein fluorescence are compared to results obtained from other biophysical methods (infrared spectroscopy and high sensitive micro-calorimetry).
Experimental
A humanised monoclonal antibody (hMAb) was made available by Boehringer Ingelheim Pharma GmbH & Co. KG (Biberach an der Riss). The aqueous antibody solution was prepared as described recently8 at a final protein concentration of 0.7 µM. The amino acid L-tryptophan (analytical grade) was from Sigma–Aldrich Chemie GmbH, Munich. Buffers, solvents and inorganic salts (Sigma–Aldrich Chemie GmbH,
Fluorescence spectroscopy was performed with an Aminco-Bowman® Series 2 Luminescence Spectrometer (Thermo Electron Corporation, WI, USA) equipped with a self-manufactured Peltier-controlled cuvette holder.
Infrared spectroscopy was carried out using the attenuated total reflection Fourier transform infrared (
Results
The results presented utilise steady-state fluorescence spectroscopy for investigating the long term average fluorescence of a sample that is irradiated with ultra violet, visible or near infrared light by measuring the intensity (F) of emitted light as a function of wavelength (l).11
For tryptophan-containing proteins excited at a wavelengths between 295 nm and 305 nm, fluorescence is emitted selectively from tryptophan residues and not from the other two intrinsic fluorophores tyrosine and phenylalanine. Depending on the location of a tryptophan amino acid within the protein structure (Figure 1), the emission maximum (lmax) and quantum yield of tryptophan residues can strongly vary. These variations are related to the three-dimensional structure of the proteins and the direct tryptophan environment. Therefore, changes of the emission spectrum may reflect changes in the protein structure.5
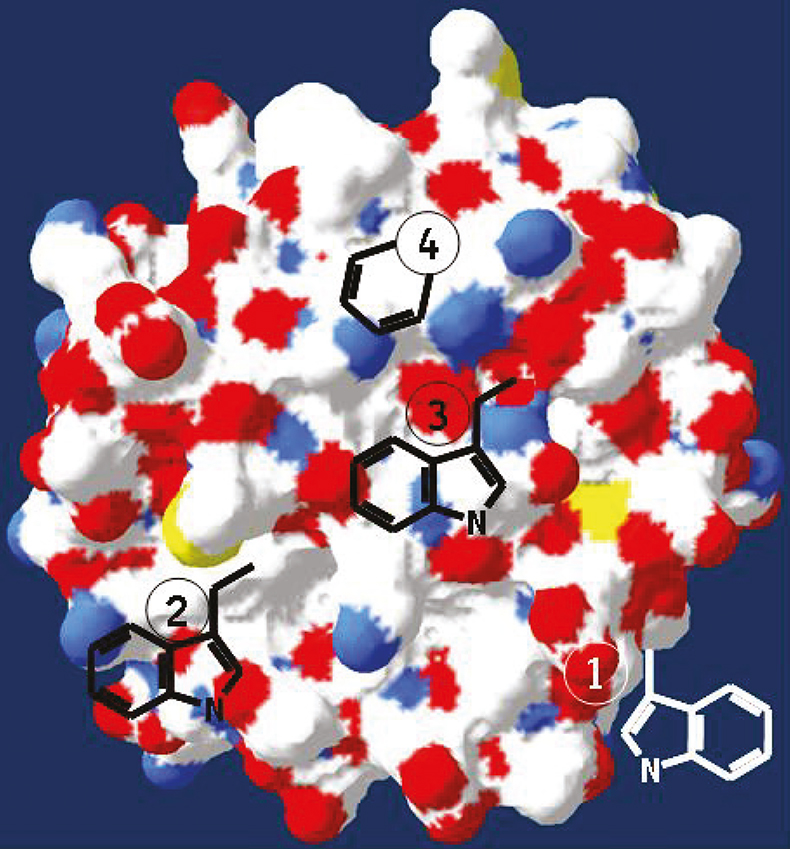
Figure 1. Schematic representation of a protein structure containing tryptophan residues located in different polar environments, with increasing polar tryptophan environment from position (4) to (1) (www.pdb.org).
The emission wavelength maximum of tryptophan depends strongly on the polar environment of the amino acid. This is exemplified in Table 1, which summarises fluorescence emission spectra of the amino acid tryptophan in different solvents of varying polarity. For tryptophan in an apolar environment (e.g. hexane) the emission maximum is blue-shifted [low lmax, lmax(hexane) »321 nm], whereas tryptophan dissolved in water shows a strong red shift [large lmax, lmax(water) »355 nm]. The data presented in Table 1 clearly show that more polar solvents have favourable interactions with the large dipole of the 1La excited state of the tryptophan indole ring leading to large lmax shifts. Solvents like hexane, where only dipole-induced dipole interactions are possible, the lmax red-shifts are smaller.
Table 1. Effect of solvent polarity on the fluorescence emission maximum (lmax) of the amino acid tryptophan (25°C). Solvent polarity decreases from water to hexane.
Solvent | lmax (nm) |
Water | 355 |
Methanol | 340 |
Ethanol | 339 |
Iso-butanol | 337 |
Ethyl acetate | 327 |
Hexane | 321 |
Thus, for the different tryptophan residues shown in Figure 1, as the tryptophan residues move towards hydrogen bonding groups and/or become exposed to water (position 4 to 1 in Figure 1A), lmax is shifted to longer wavelengths (red shift).
Analysing single-tryptophan proteins one can in this case assign the structural changes to the protein domain where the tryptophan is located.12 Alterations of protein domains containing no tryptophan can therefore not be observed, unless such a structural change has an impact on the tryptophan containing domain (e.g. quenching effects).
However, even for single-tryptophan proteins, the observed emission is an averaged signal. Kim et al.13 have presented an excellent fluorescence study of the single-tryptophan protein phosphofructokinase showing that the origin of the multi-exponential decay is indicative of multiple conformational states that interconvert on a time scale slower compared to the fluorescence emission time scale. The results of this study enforce the hypothesis of conformational heterogeneity within proteins.
Investigating multi-tryptophan proteins, the situation is much more complex in the sense that the emission spectrum reflects the combination of all tryptophans located in different structural regions with different environments. Burstein and others14–16 have presented an approach by dividing proteins into classes based on their emission spectrum, by considering that the tryptophan emission spectrum reflects the average environment of the tryptophan. Supported by their database and calculations, Burstein and co-workers are able to correlate the fluorescence observables of individual tryptophan residues to microenvironment parameters.
Investigating various solution conditions one has to be aware that excipients present in the formulation may have a direct impact on the tryptophan emission, e.g. quenching effect.17 The dynamic quenching of fluorescence emission of tryptophan in proteins arises from excited-state encounters of the tryptophan with the functional groups of the amino acids in the surrounding protein matrix or from encounters and collisions with the solvent.6,18
During the pre-formulation phase the influence of various solution conditions, e.g. ionic strength, presence of buffer salts and excipients, pH, are varied. Weichel et al.8 have recently investigated the effect of such solution conditions with respect to the fluorescence emission of tryptophan. They used the amino acid tryptophan as a model compound. Weichel et al.8 showed that the knowledge of the influence of these solution conditions with regard to the tryptophan fluorescence emission is crucial for the correct interpretation of changes in the intrinsic protein fluorescence for various formulations.
However, it has to be kept in mind, that the fluorescence properties of intrinsic tryptophan residues in proteins invariably changes upon unfolding and denaturation.19 Up to now, it is basically impossible to predict correctly how the fluorescence intensity will change upon denaturation. However, the emission maximum of tryptophan residues in proteins typically shifts to the long-wavelength range (red shift) upon denaturation in water (Table 2). The reason for this wavelength shift is tryptophan-solvent exposure, and thus increase in solvent relaxation in the unfolded state.20
As can be seen from Table 2, the magnitude of the wavelength shift depends on the extent to which the protein is buried in the native state and is exposed to water in the denatured state. Chemical denaturation of an antibody induces a more open conformation with the tryptophan residues much more exposed to water, compared to a thermally denatured antibody. Furthermore, internal and external quenching effects have also to be considered, which may have a more or less strong influence on the fluorescence spectrum.
Table 2. Average emission maximum wavelength (lmax) of tryptophan residues of a human monoclonal antibody (hMAb). The hMAb is chemically denatured (unfolded) by the presence of guanidinium hydrochloride and denatured by heating above 90°C (temperature denatured).
System (water pH 6.5, 25°C) | lmax (nm) |
hMAb (native) | 330 |
hMAb (chemically denaturated) | 352 |
hMAb (temperature denaturated) | 337 |
To rank the order of stability of a protein under different solution conditions one has to apply a certain stress on the samples. For this purpose a well-defined thermal stress is extremely useful. Different protein formulations are prepared and their tryptophan emission spectra are recorded from 310 nm to 390 nm upon excitation at 295 nm in steps of 1 K in the range from 20°C to 90°C. The sample cuvette containing the protein solution is equilibrated for 90 s at every temperature. After smoothing the raw spectra (seven-point Savitzky–Golay algorithm) the position of peak maxima, expressed as the ratio of emission intensity at 350 nm to that at 330 nm, are plotted as a function of temperature. The resulting thermograms were smoothed and transition temperatures (Tm) were obtained from their second derivatives. The transition temperature(s) describes the temperature(s) at which a change in the tryptophan environment occurs as a consequence of temperature increase and thus protein conformational changes.
Figure 2 shows typical results that allow the discrimination of the thermal-induced conformational stability of a protein. As can be seen from Figure 2, at low pH (formulation F1) two transitions are detected (44°C and 61°C). The transitions are manifested by an increase of the intensity ratio F350 / F330. At the inflection point (obtained using second derivative data treatment) an apparent melting temperature (Tm) is defined. Increasing the solution pH shifts the transition to higher temperature and with this, increased conformational protein stability.
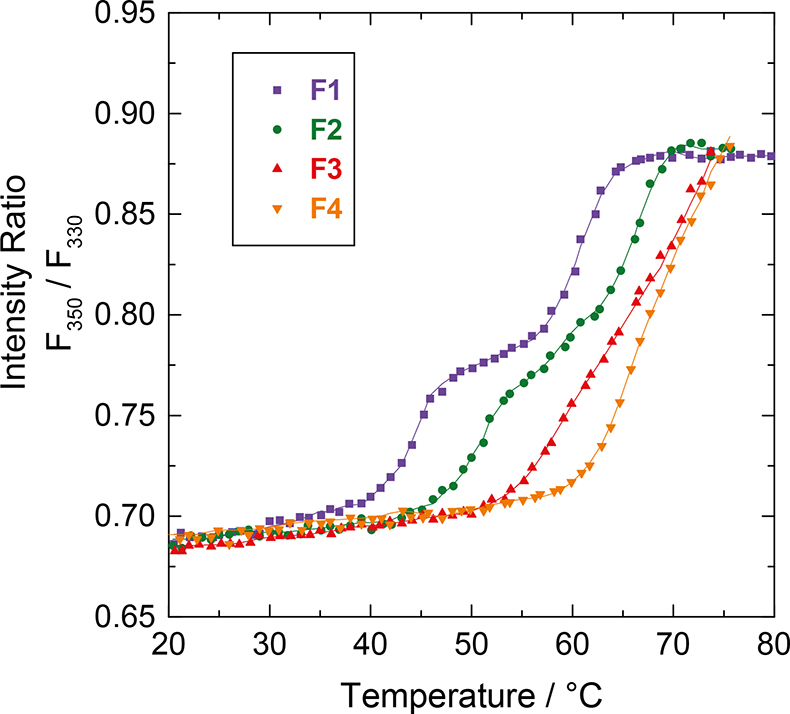
Figure 2. Screening the thermal conformational stability of a hMAb (human monoclonal antibody) for different formulation conditions. The fluorescence observable is the intensity ratio F350 / F330. Buffer composition: 20 mM phosphate buffer at 300 mOsmol, F1 (pH 4.5), F2 (pH 5.5), F3 (pH 6.5), F4 (pH 7.5).
Other biophysical techniques used to determine the thermal conformational stability of proteins in solution are high sensitive differential scanning calorimetry (hs-DSC) or FT-IR spectroscopy.21 For both techniques well-defined thermal heating protocols are used to induce protein unfolding. However, the observables and thus the physical principles for these techniques are quite different. Using hs-DSC one registers a change in heat capacity upon heating the sample. In the heating mode, an endothermic reaction is measured due to, for example, the breaking and destruction of hydrogen bonds of the protein structure. Using infrared spectroscopy the amount of secondary structure elements, e.g. alpha-helix or beta-sheet structure, are calculated and the changes of these structures are considered as a function of temperature.10 Behind the different physical principles of the used techniques, there is also a great difference with respect to the protein concentration that can be investigated. For a fluorescence assay the protein concentrations are quite low of about 0.1–1 µM or even less, whereas for the hs-DSC experiment the protein amount required is at least one magnitude of order higher. For the investigation of highly concentrated protein solutions up to 300 µM, infrared spectroscopy is well suited.
In Figure 3 these are exemplified in the results shown obtained using the three techniques. The thermal stress for the three methods is quite similar with 0.8–1 K min–1.
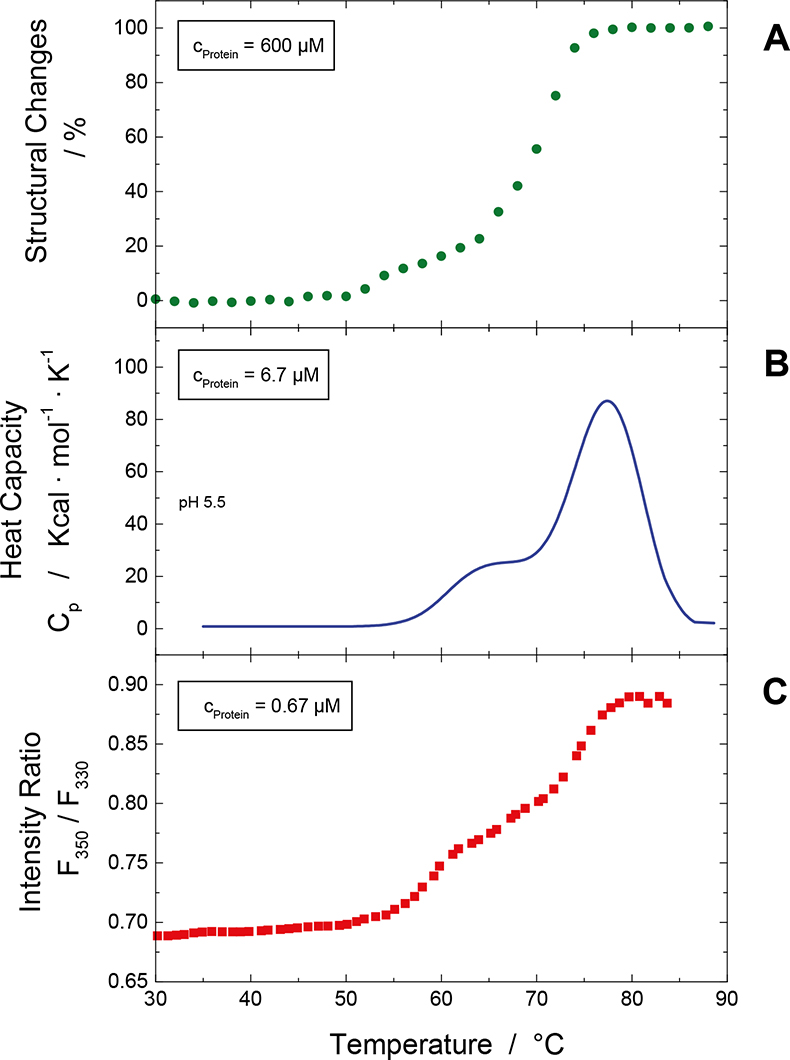
Figure 3. Thermal stability screening of a hMAb at different protein concentration for the same formulation using different biophysical screening techniques. (A) changes in the content of the secondary structure elements with respect to temperature as assessed by ATR-FT-IR spectroscopy, (B) change in the heat capacity curve as measured by DSC, (C) change in the intensity ratio F350 / F330 (see text) with respect to temperature as obtained from ITF.
The comparison of the results obtained by the three methods is quite useful, because one gains insight into structural stability parameters. For the correct interpretation and comparison of the results it is essential that the temperature scan controller of each of the instruments is temperature calibrated and that the applied temperature scan rate is very similar. Furthermore, one has to consider the influence of the protein concentration with respect to the applied stress. This can easily be probed by performing the experiments at different protein concentration.
The melting temperatures obtained from the three methods do not necessarily have to coincide, because the observables for the three techniques are quite different. Changes in the emission maximum of the fluorescence spectrum indicate that the tryptophan environment has changed, due to, for example, changes in tryptophan polarity induced by the penetration of water or exposure of the tryptophan residue to water. Whether this is related with changes in the protein secondary structure, e.g. transition from alpha-helical structure to random coiled structures, is a priori not directly linked. Analysing the fluorescence and infrared data allow one to judge if such structural variations are linked or not and give insights into the overall conformational stability.
Knowing the structure of the investigated protein, these results allow one to more clearly identify regions that are more sensitive to formulation changes, and thus conformational stability.
Conclusions
Although steady-state intrinsic tryptophan protein fluorescence spectroscopy is not new, applications in pre-formulation as a method for rapidly screening a number of solution parameters affecting protein stability are relatively uncommon.
Our studies have revealed that steady-state fluorescence spectroscopy is a reliable method for probing the thermal conformational stability of monoclonal antibodies, because it represents a very sensitive method to monitor thermally induced structural changes. Compared to other biophysical screening methods steady-state intrinsic tryptophan protein fluorescence spectroscopy gives additional information on conformational stability and the fluorescence assay should be used as an orthogonal method.
Decisive advantages for the fluorescence assay, especially in the early pharmaceutical biotechnology development phase for the evaluation and screening of liquid protein formulations with the intention of ranking the relative order of protein conformational stability in various formulations, is based on the extremely high assay sensitivity with a favourable signal-to-noise ratio, the reduced amount of sample material required per experiment (below 50 µg), the avoidance of external dyes (as used in extrinsic fluorescence spectroscopy) that may impact the protein structure, the straightforward experimental handling and data analysis, reliability, accuracy and robustness of the assay.
Acknowledgements
Mrs Inge Miller is acknowledged for her excellent technical assistance, Michael Weichel for helpful and fruitful discussions and Stefan Bassarab for supporting the studies.
References
- S. Dübel (Ed.), Handbook of therapeutic antibodies, Volume I–III. Wiley-VCH, Weinheim (2007). https://doi.org/10.1002/9783527619740
- K. Bergemann, C. Eckermann, P. Garidel, S. Grammatikos, A. Jacobi, H. Kaufmann, R. Kempken and S. Pisch-Heberle, in Handbook of therapeutic antibodies, Ed by S. Dübel. Wiley-VCH, Weinheim, part 1, chapter 9, p. 199 (2007).
- J.M. Hollas, Spectroscopie. Dunod, Paris (1998).
- R. Winter and F. Noll, Methoden der Biophysikalischen Chemie. Teubner Verlag, Stuttgart (1998). https://doi.org/10.1007/978-3-663-05794-9
- J.R. Lakowicz, Principles of Fluorescence Spectroscopy, 3rd Edn. Springer, New York (2006). https://doi.org/10.1007/978-0-387-46312-4
- C.A. Royer, Chem. Rev. 106, 1769 (2006). https://doi.org/10.1021/cr0404390
- L. Stryer. Science 162, 526 (1968). https://doi.org/10.1126/science.162.3853.526
- M. Weichel, S. Bassarab and P. Garidel, BioProcess Int. 6(6), 42 (2008).
- P. Garidel and H. Schott, BioProcess Int. 4(5), 40 (2006).
- P. Garidel and H. Schott, BioProcess Int. 4(6), 48 (2006).
- M.R. Eftink, Biophys. J. 66, 482 (1994). https://doi.org/10.1016/S0006-3495(94)80799-4
- M.R. Eftink, Methods Biochem. Analysis 35, 127 (1991).
- S.J. Kim, F.N. Cowdury, W. Stryjewski, E.S. Younathan, P.S. Russo and M.D. Barkley, Biophys. J. 65, 215 (1993). https://doi.org/10.1016/S0006-3495(93)81070-1
- E.A. Burstein, S.M. Abornev and Y.K. Reshetnyak, Biophys. J. 81, 1699 (2001). https://doi.org/10.1016/S0006-3495(01)75823-7
- Y.K. Reshetnyak and E.A. Burstein, Biophys. J. 81, 1710 (2001). https://doi.org/10.1016/S0006-3495(01)75824-9
- Y.K. Reshetnyak, Y. Koshevnik and E.A. Burstein, Biophys. J. 81, 1735 (2001). https://doi.org/10.1016/S0006-3495(01)75825-0
- M.R. Eftink, Y. Jia, D. Hu and C.A. Ghiron, J. Phys. Chem. 99, 5713 (1995). https://doi.org/10.1021/j100015a064
- P.R. Callis, Methods Enzymol. 278, 113 (1997). https://doi.org/10.1016/S0076-6879(97)78009-1
- J.T. Vivian and P.R. Callis, Biophys. J. 80, 2093 (2001). https://doi.org/10.1016/S0006-3495(01)76183-8
- Y. Chen and M.D. Barkley, Biochemistry 37, 9976 (1998). https://doi.org/10.1021/bi980274n
- C.R. Cantor and P.R. Schimmel, Biophysical Chemistry. Part II. W. H. Freeman (1980).