Articles
The sound of science
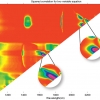
I recently “discovered” a very interesting radio programme on BBC Radio 4. It is “devoted to the powerful, sometimes beautiful, often abused but ever ubiquitous world of numbers”. A few weeks ago we were asked to say what we were doing while listening to the programme. The next week we were told that nearly 2000 e-mails had been received and this data had been given to information designer David McCandless to turn into a graphic. When this was trailed I got the impression that something new and exciting was going to be displayed and I thought that the graphic would include sound. The graphic is good but rather “ordinary” and I was disappointed. This got me thinking about how we display information. Have we made any advance in the last 25 years? Could sound be used!
AnIMLs in from the wild: XML standards at LGC
Analytical Information Mark-up Language, better known as AnIML, has been around as a concept for a number of years, but how does an analytical chemist use it in the real lab? A team of R&D scientists at LGC has been finding out.
Something has happened to my data: potential problems with standard normal variate and multiplicative scatter correction spectral pre-treatments
This column has been developed from two recent publications by Tom Fearn. "The effect of spectral pre-treatments on interpretation” and "On the geometry of SNV and MSC"
And now for something completely different!
This column is about “Computational Chemistry”.
The definition of Chemometrics is: “The application of mathematical and statistical techniques to extract information from complex data”. You might think that it is computational chemistry, but I suspect that the majority of people who use computational chemistry have little knowledge or interest in chemometrics and similarly most chemometricians have little interest in computational chemistry. Computational chemistry uses the results of theoretical chemistry, incorporated into efficient computer programs, to calculate the structures and properties of molecules and solids. It seems that these two topics are conducted by two groups on parallel tracks, which, of course, never meet. This could be a mistake.

Opportunities and opinions
I would like to thank everybody who has taken the trouble to respond to my last column on Educating Spectroscopists.1 I am very happy that Ian has allowed me space to reproduce some of them in this edition.
Shedding light on evidence: forensic applications of UV/visible spectroscopy
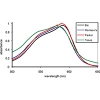
This short review shows that UV/visible spectroscopy plays a key role in the discrimination of colour in the forensic analysis of fibres and inks. The application of chemometrics, however, is vital in many cases to enhance such discrimination and to put it on a quantitative basis so providing objective justification for the conclusions of the analyst.
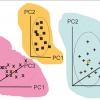
Back to basics: multivariate qualitative analysis, SIMCA
In our previous column we introduced CVA, one of the very early applications of multivariate analysis (1930s). In this column we will discuss SIMCA (officially it is Soft Independent Modelling of Class Analogies, but no one uses the long form!). SIMCA was invented 30 years later by another pioneer, Svante Wold (the man who coined the word “chemometrics”).
Back to basics: multivariate qualitative analysis, canonical variates analysis
A.M.C. Daviesa and Tom Fearnb
aNorwich Near Infrared Consultancy, 75 Intwood Road, Cringleford, Norwich NR4 6AA, UK. E-mail: [email protected]
bDepartment of Statistical Science, University College London, Gower Street, London WC1E 6BT, UK. E-mail: [email protected]
Back to basics: qualitative analysis, introduction
A.M.C. Davies and Tom Fearn
Norwich Near Infrared Consultancy, 75 Intwood Road, Cringleford, Norwich NR4 6AA, UK. E-mail: [email protected]
Department of Statistical Science, University College London, Gower Street, London WC1E 6BT, UK. E-mail: [email protected]
Who has the best proton NMR crystal ball?
There has been much debate about which program can predict NMR spectra the best. It is well known within the NMR community that spectra prediction strongly depends on the “quality” of the starting data sets for those systems which use real data as a knowledge base. It has become a hot topic in some blogs, although disappointingly most of the authors tend to have affiliations to one software vendor or another.
Back to basics: the "final" calibration
The starting point for this column is the last one from last year! In that column TD began what was intended to be a two-part story but has, with this column, become a story in four parts. There were required topics we had not covered and we need to begin this column by completing the discussion of removing multiplicative effects by describing what the two most popular methods do to NIR spectra.
Adobe PDF use in analytical information storage and archiving
When we set up ALIS GmbH one of the first major “discoveries” was probably the most embarrassing for me. Having worked on analytical data standards for so long, I seem to have successfully generated a blind spot for the developments which have taken place in the structure, standardisation and functionality of the Portable Document Format (PDF).2 Maybe it’s due to a subconscious aversion to what I had for a long time seen as a simplistic “get out” solution for those too lazy to convert data into a long-term, stable, vendor-neutral format. How often have we heard the “well... we just print to PDF” as an excuse for not having in place a properly thought through analytical data storage and archiving policy taking no account of the future use to which that data may well be put within an organisation.
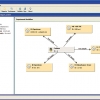
Anyway, it has been pretty difficult for me to admit that my knowledge of the available functionality lay somewhere back in the early 1990s (see Figure 1) but I hope in this column to make some amends!
Back to basics: removing multiplicative effects (1)
The last TD column showed the effect of calculating second derivatives on a set of 100 spectra, which will be the starting point for this column.
Back to basics: spectral pre-treatments, derivatives
This column is about the most basic of pre-treatments, which has been used in spectroscopy well before the word "Chemometrics" was invented.
eMolecules and spectroscopy
Tony Davies investigates eMolecules. The system is essentially a clearing-house for metadata and chemical structure metadata indexing of numerous third-party chemical information providers.
Back to basics: running your first PLS calibration
A.M.C. Davies
Norwich Near Infrared Consultancy, 75 Intwood Road, Cringleford, Norwich NR4 6AA, UK. [email protected]
An evergreen problem in multivariate calibration
N.M. Faber,a,* and R. Rajkób
aChemometric Consultant, Rubensstraat 7, 6717 VD Ede, The Netherlands. [email protected]
bDepartment of Unit Operations and Food Engineering, Szeged College of Food Engineering, University of Szeged, H-6701 Szeged, POB 433, Hungary
Back to basics: preparing for PLS calibration
A.M.C. Davies
Norwich Near Infrared Consultancy, 75 Intwood Road, Cringleford, Norwich NR4 6AA, UK
Prague ELN days 2006 The search for an electronic laboratory notebook for research and teaching
Tony Davies,a John Trygg,b Pavel Matĕjkac and Karol Volka
aExternal Professor, University of Glamorgan, UK, Director, ALIS Ltd, Analytical Laboratory Informatics Solutions
bPhaseFour Informatics Limited, [email protected]
cDepartment of Analytical Chemistry, Institute of Chemical Technology, Technika 5, 166 28 Prague 6–Dejvice, The Czech Republic
Back to basics: calibration statistics
A.M.C. Daviesa and Tom Fearnb
aNorwich Near Infrared Consultancy, 75 Intwood Road, Cringleford, Norwich NR4 6AA, UK
bDepartment of Statistical Science, University College London, Gower Street, London, UK