Tony Davies
Norwich Near Infrared Consultancy, 75 Intwood Road, Cringleford, Norwich NR4 6AA, UK
Fans of “Monty Python’s Flying Circus” will realise that what follows is not likely to be my usual column (and they might be hoping that it will be amusing).
Introduction
This column is about “Computational Chemistry”. The definition of Chemometrics is: “The application of mathematical and statistical techniques to extract information from complex data”. You might think that it is computational chemistry, but I suspect that the majority of people who use computational chemistry have little knowledge or interest in chemometrics and similarly most chemometricians have little interest in computational chemistry. Computational chemistry uses the results of theoretical chemistry, incorporated into efficient computer programs, to calculate the structures and properties of molecules and solids. It seems that these two topics are conducted by two groups on parallel tracks, which, of course, never meet. This could be a mistake.
Computational chemistry
Just when I had decided that there was nothing I wanted to write about in this issue, I received an e-mailed advertisement for “Spartan a program for computational chemistry”. I was about to send it to trash when I noticed that one of the options was “Computation of IR spectra”. This was interesting. I had heard of such programs but had never met anyone who used them or knew anything about them. My idea had been that if you could compute NIR spectra that this would be a very useful aid to understanding and interpreting NIR spectra. I accepted the offer to download a “demo”.1
This turned out not to be a demo, but a working version of the program (with a life of one month!). There is a good tutorial which gives very exact instructions on how to perform various tasks. I started with the computation of IR spectra (chapter 4) but had to give up and start at chapter 1. “I will say this only once”, you need to start at chapter 1! Spartan is a chemistry set in a computer. There is a molecule building program where you can synthesise large and complex molecules. The finished molecule can be displayed in a number of options and is rotational in three dimensions. You can measure bond lengths and angles, see bond vibrations, investigate hydrogen bonding etc.
The heart of Spartan is the computational engine for quantum mechanics. (I assume that the rational behind computational chemistry is that all chemistry can be derived from physics and all physics can be computed by mathematics.) I find the Schrödinger equation very frightening (probably quite worrying for cats) but as it can only be solved for H2, you might think computational chemistry is going to be a slim volume. The answer is that many researchers have produced modifications which are computable (but some of them need very powerful computers).
Once you have a molecule, you can set up a request for computation. This is where you select what answer you want and whose method and procedure you want to use.
For my first attempt I choose an available molecule, cyclohexane. The tutorial told me to use “Hartree–Fock” as the method and 3-21G as the basis. Spartan took about a minute to compute the IR spectrum and gave the answer in a table of frequencies, vibrational modes and intensities. If you still have the molecule on the screen you can click on to an absorption and the appropriate bond vibrates in the molecule; it is fun!
Now you can go to the display module and set the display of your spectrum. The result is a disappointment, it doesn’t look like any IR spectrum you have ever recorded—it is just a line spectrum, Figure 1. Spartan computes the spectrum at absolute zero; so there is no line broadening. In the control panel there is a slider marked “Temp” and as you slide it the lines broaden (using a Lorentzian function), Figure 2. If you are at all familiar with IR spectroscopy you will have noticed that there is a considerable error in the wavenumber computations. It turns out that Hartree–Fock is computationally undemanding and it produces good answers for some properties but is usually 6–10% in error for frequencies. The display control panel has another slider marked “Scale” and it will move the whole spectrum left or right. At this point you really want to compare it to an experimentally measured spectrum and the demo has thoughtfully made the ones you might want available. So we can call up the experimental spectrum for cyclohexane and display it, then use the Scale control to move the computed spectrum so that the absorption bands line-up, sort of! Figure 3 is not the most convincing match you have ever seen!
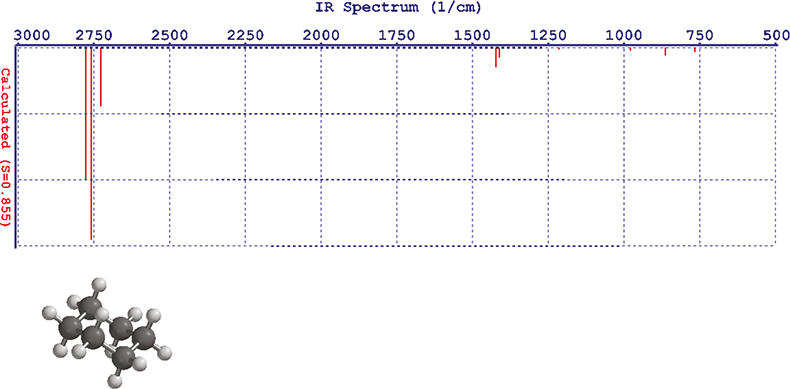
Figure 1. Initial display of the computed spectrum of cyclohexane.
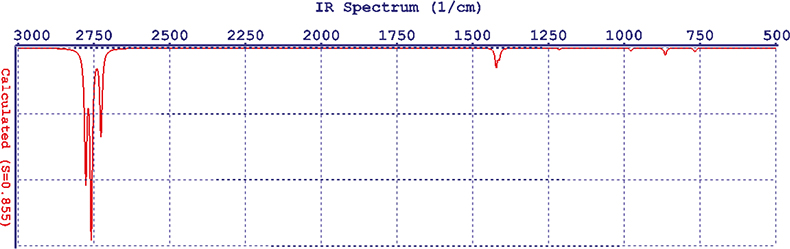
Figure 2. The computed spectrum of cyclohexane after line broaden
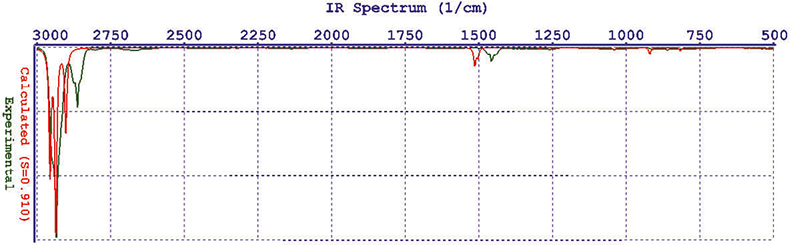
Figure 3. Computed compared to experimental spectra of cyclohexane.
The recommended method for computing IR spectra is known as Density Functional models, EDF/2. I could not get this to work: I assume my computer is much too small. However, I have been sent some spectra from the producers of Spartan2 (in California) computed with EDF/2 and these are shown in Figures 4–6. I think you will agree that these are really quite good!
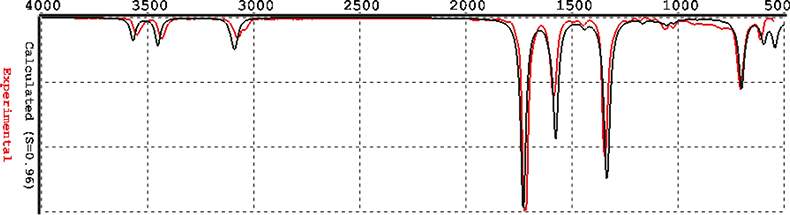
Figure 4. Benzamide computed by EDF/2.
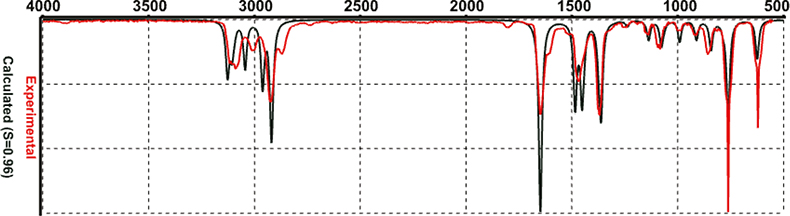
Figure 5. (Dimethylmethylidine)cyclopentadiene computed by EDF/2.
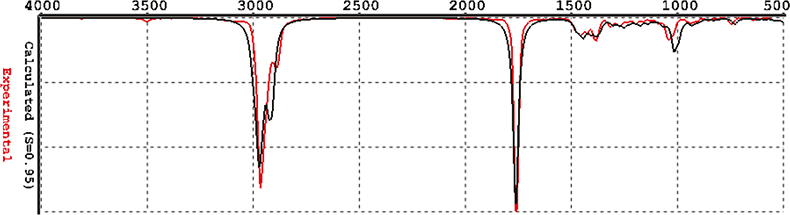
Figure 6. Camphor computed by EDF/2.
Why do I find this interesting?
This program only computes IR spectra—well it does do NMR and UV/vis but I’m not interested in those, my interest is in NIR spectroscopy. However, data can be written to an internal spreadsheet and this can be written to an Excel spreadsheet. So the challenge is now to produce an NIR spectrum from the IR data. In addition to helping to interpret NIR spectra I have half an idea that computed spectra might be used as instrument standards but more about this if I can formulate the other half of the idea—how to do it!
Acknowledgements
I am grateful to Gerard McBreen and Sean Ohlinger for helpful discussions and advice and to Warren Hehre for the spectra shown in Figures 4–6.