Articles
Near infrared reflectance spectroscopy in ecological studies of plant-animal interactions
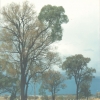
The enormous variability in the concentration of plant toxins and nutrients in trees, shrubs and forbs requires extensive sampling to accurately represent the nutritional and toxicological landscape and this is an ideal application for quantitative near infrared (NIR) reflectance spectroscopy. The speed of NIR spectroscopy analysis makes it ideally suited to environmental monitoring and ecological investigations where large numbers of replicates need to be measured. Several recent studies, including one focused on underwater plants on the Great Barrier Reef and the second in Bolivian rainforests, show the power of NIR spectroscopy to address large-scale variability in plant–animal interactions.
Exploring the "forgotten" region: an update on NIR spectrometry
Following on from our previous foray into the UV-visible area of the spectrum, in this article we discuss its nearest neighbour in the spectral scale, namely near infrared (NIR) spectrometry. The NIR spectral region lies between 780 nm and 2500 nm (4000 cm–1 to 12,800 cm–1) bridging the more well-known and analytically used regions of the UV-visible (190–780 nm) and the infrared (4000–600 cm–1).
In-line monitoring of coating processes by near infrared reflection spectroscopy
It is shown here that NIR reflection spectroscopy is able to follow even small variations of both the conversion and the thickness of thin coatings and that it accordingly can be used as an efficient in-line measuring method.
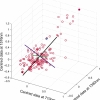
Back to basics: multivariate qualitative analysis, canonical variates analysis
A.M.C. Daviesa and Tom Fearnb
aNorwich Near Infrared Consultancy, 75 Intwood Road, Cringleford, Norwich NR4 6AA, UK. E-mail: [email protected]
bDepartment of Statistical Science, University College London, Gower Street, London WC1E 6BT, UK. E-mail: [email protected]
Back to basics: qualitative analysis, introduction
A.M.C. Davies and Tom Fearn
Norwich Near Infrared Consultancy, 75 Intwood Road, Cringleford, Norwich NR4 6AA, UK. E-mail: [email protected]
Department of Statistical Science, University College London, Gower Street, London WC1E 6BT, UK. E-mail: [email protected]
Back to basics: the "final" calibration
The starting point for this column is the last one from last year! In that column TD began what was intended to be a two-part story but has, with this column, become a story in four parts. There were required topics we had not covered and we need to begin this column by completing the discussion of removing multiplicative effects by describing what the two most popular methods do to NIR spectra.
Back to basics: removing multiplicative effects (1)
The last TD column showed the effect of calculating second derivatives on a set of 100 spectra, which will be the starting point for this column.
NIR evaluation of the quality of tea and its market price
This article focusses on the application of near infrared (NIR) spectroscopy as a potential substitute to the sensory evaluation of tea quality.
Back to basics: spectral pre-treatments, derivatives
This column is about the most basic of pre-treatments, which has been used in spectroscopy well before the word "Chemometrics" was invented.
Near infrared spectroscopy: the workhorse in the PAT toolbox
Erik Skibsted
Novo Nordisk, CMC Supply, Analytical Development, Denmark. E-mail: [email protected]
Food authentication: has near infrared spectroscopy a role?
Gerard Downey,a* J. Daniel Kellya and Cristina Petisco Rodriguezb
aTeagasc, Ashtown Food Research Centre, Ashtown, Dublin 15, Ireland. E-mail: [email protected]
b Instituto de Recursos Naturales y Agrobiología, CSIC, Apdo 257, 37071 Salamanca, Spain
Simultaneous near infrared spectroscopy and dynamic rheological analysis for process monitoring of reactive polymers
S. Benali,a D. Bertrand,b J. Dupuyc and G. Lachenald
aUniversité de Mons Hainaut, Matériaux Polymères et Composites, Place du Parc, 20 ,7000 Mons, Belgium
bENITIAA-INRA, Unité de Sensométrie et Chimiométrie, BP 82225, 44322 Nantes Cedex 03, France. E-mail: [email protected]
Back to basics: applications of principal component analysis
A.M.C. Davies
Norwich Near Infrared Consultancy, 75 Intwood Road, Cringleford, Norwich NR4 6AA, UK
NIR spectroscopy explores the mysteries of acupuncture
Gerhard Litscher
Biomedical Engineering and Research in Anesthesia and Intensive Care Medicine, Medical University of Graz, Auenbruggerplatz 36, A-8036 Graz, Austria. E-mail: [email protected]; http://litscher.at; http://litscher.info
Back to basics: the principles of principal component analysis
PCA is a mathematical method of reorganising information in a data set of samples. It can be used when the set contains information from only a few variables but it becomes more useful when there are large numbers of variables, as in spectroscopic data.
Independence rules (or Rules for independence)
A.M.C. Davies
Norwich Near Infrared Consultancy, 75 Intwood Road, Cringleford, Norwich NR4 6AA, UK
MEMS technology moves process spectroscopy into a new dimension
Richard A. Crocombe
Axsun Technologies, Inc., 1 Fortune Drive, Billerica, MA 01821, USA
What is PAT?
A.M.C. Davies
Norwich Near Infrared Consultancy, 75 Intwood Road, Cringleford, Norwich NR4 6AA, UK
Doing it faster and smarter (Lesson 6 of Matrix Algebra)
A.M.C.Davies,a and Tom Fearn,b
aNorwich Near Infrared Consultancy, 75 Intwood Road, Cringleford, Norwich NR4 6AA,UK
bDepartment of Statistical Science, University College London, Gower Street, London
"Is near infrared spectroscopy only as good as the laboratory reference values?" An empirical approach
D.B. Coates
CSIRO Sustainable Ecosystems, Davies Laboratory, PMB PO Aitkenvale, Qld 4814, Australia