Articles

Letter to the Editor: origins of volume fraction for better calibrations
Following on from a recent column that reported on work which had shown that weight fractions were often incorrect concentration units to use in quantitative chemometric studies, Howard Mark goes into more detail.
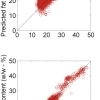
Weights or measures for better calibration
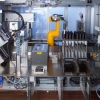
In quantitative analysis, is it better to weigh materials when making up standard solutions or to use volumetric techniques? Traditionally, the answer has been “volume”, however, things may not be as straightforward as they seem. Henk-Jan and colleagues have conducted a new experiment, using robots for both sample preparation and spectroscopic analysis which may provide a definitive answer. Unfortunately, the answer must wait for publication of their paper, but Tony and Henk-Jan’s history of this question makes interesting reading nevertheless.
Pre-processing spectroscopic data: for good or ill?
The authors offer many useful points to consider when using pre-processing techniques.
Sampling for spectroscopic analysis: consequences for multivariate calibration
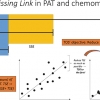
The Sampling Column points out that incorrect sampling is irreversible: no amount of chemometrics or further samples will be able to produce a valid model if the sampling is not representative. This applies in flowing PAT analyses as much as in static.

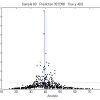
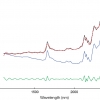
Infrared spectroscopy and chemometrics to evaluate paper variability in document dating
Spectroscopy is widely used in forensics, but the determination of the age of documents was one application I had not considered. With a huge variety of papers and inks available, each with their own ageing profiles, and with such ageing depending on environmental factors, the determination of the age of a document is not straightforward. However, infrared spectroscopy and chemometrics may have the answer.
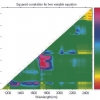
Glowing colours of foods: application of fluorescence and chemometrics in food studies
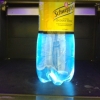
Whilst the major components of food are usually non-fluorescent, many minor food components that affect its nutritive, compositional and technological quality are fluorescent. Given its sensitivity, ease of use and non-destructive nature, this makes it useful in many applications around monitoring food processing and in fundamental food research.
The last furlong (6). The finishing line is in sight!
This is Tony’s last column for Spectroscopy Europe. It is explores an idea that he has been developing for over 30 years, although as Tony points out the story starts around 3500 years ago.
The last furlong (5). Classification and identity testing
Tony (A.M.C.) Davies continues on his last furlong, this time considering “Classification and identity testing”. As well as some interesting insights into the analytical lab in the late 1960s, he gives his opinion on various chemometric techniques and on identity testing, as well as thoughts on future development.
The last furlong (4). Multi-variable regression
Tony (A.M.C.) Davies looks at Multiple Linear Regression (MLR) this issue, as well as expressing his opinions about Principal Components Regression (PCR) and Partial Least-Squares (PLS).
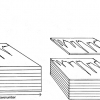
The last furlong (3). Principal component analysis
Tony (A.M.C.) continues down the last furlong of his series of Tony Davies Column articles. This issue, he considers principal component analysis (PCA). Using research recently published in the Journal of Near Infrared Spectroscopy, he explains that PCA is a very useful tool but it will not solve all our problems. Two old articles on PCA, including Tony’s concept of the “Data Cake” have been added to the website, are referenced in Tony’s article and can be freely downloaded by readers.
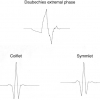
The last furlong (2). Data Compression by wavelets
Now that Tony understands wavelets, he is in the perfect position to explain them to the rest of us! Whilst wavelet compression is an interesting and popular method, it is worth confirming that there is a real benefit in using them compared to FT compression, especially for near infrared spectra where there are few regions of flat baseline.
The last furlong (1). Data compression
Tony (A.M.C.) Davies starts a review of the chemometric ideas that have most excited him over the last 30 years. In this column, he looks at the use of Fourier transformation for data compression. FT can also provide the side benefit of reducing high-frequency noise.
Variable selection for regression analysis: an up-date on an old problem
Tony (A.M.C.) Davies and Tom Fearn describe an enhancement of the popular partial least squares (PLS) technique, powered partial least squares (PPLS), that has shown significantly better results.
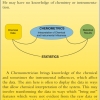
What IS and what is NOT chemometrics
Tony Davies makes sure we understand “What IS and what is NOT chemometrics” and why it matters.
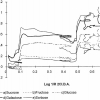
Examining diffuse reflection and transmission spectra more thoroughly: Part 2. Sample temperature and sample composition
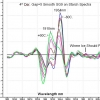
The Tony Davies Column once again contains a contribution from Karl Norris, who is widely regarded as the “father of NIR spectroscopy”. Karl continues to produce innovative ideas about the field and this article is no different. Building on the previous article concerning fourth derivatives, Karl has investigated the effect of varying gap sizes with some remarkable results.
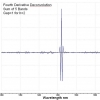
Examining diffuse reflection and transmission spectra more thoroughly: Part 1. Instrument noise
This Tony Davies Column is contributed by Karl Norris, known to many as “The father of near infrared spectroscopy”. He introduces his calculation method for fourth derivatives and shows how it can be used to extract instrument noise.
Always look at the spectrum: Part 2. 3-D Normalisation
Tony (A.M.C.) Davies is again telling us to “Always look at the spectrum”. This time he uses an example from the development of a NIR spectrometer to demonstrate that one doesn’t really know what’s going on until one has “looked at the spectrum”.
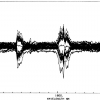
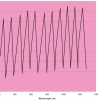
Always look at the spectrum: Part 1. NIR noise spectra
Tony (A.M.C.) Davies stresses the importance of always looking at the spectrum, even if you [think you] know there’s nothing to learn. He relates his experience with noise in NIR spectra and what he has learnt from it. He would like us all to examine spectra for abnormality before relying on automated methods.
A digression on regression
Tony Davies and Tom Fearn present “A digression on regression”. They turn their attention to one of the simpler regression techniques, Classical Least Squares (CLS). As well as an explanation of the basics, they explain why it is not often used in spectroscopy, and give the pros and cons of various regression techniques.
The sound of science
I recently “discovered” a very interesting radio programme on BBC Radio 4. It is “devoted to the powerful, sometimes beautiful, often abused but ever ubiquitous world of numbers”. A few weeks ago we were asked to say what we were doing while listening to the programme. The next week we were told that nearly 2000 e-mails had been received and this data had been given to information designer David McCandless to turn into a graphic. When this was trailed I got the impression that something new and exciting was going to be displayed and I thought that the graphic would include sound. The graphic is good but rather “ordinary” and I was disappointed. This got me thinking about how we display information. Have we made any advance in the last 25 years? Could sound be used!