Iain A. Larmour, Jennifer P.E.D. Gray and Steven E.J. Bell
Innovative Molecular Materials Group, School of Chemistry and Chemical Engineering, Queen’s University Belfast, Belfast, BT9 5AG, UK
Introduction
Interest in Raman spectroscopy as an analytical technique that can be applied in a wide variety of fields continues to increase. The main reason for this interest is that no special sample preparation is required. However, the Raman signal is typically very weak, with only one in every 106–108 photons being scattered. This has driven the development of several enhancement techniques, e.g. Resonance Raman (RR), Surface Enhanced Raman Spectroscopy (SERS) and Surface Enhanced Resonance Raman Spectroscopy (SERRS), which can be used for dilute samples. In order to be enhanced, the target species must either have an electronic absorption at the laser excitation wavelength or be attracted towards a structured metallic substrate where the molecular vibrations can be coupled to the surface plasmons. Clearly, this means that these enhancing techniques are not universal.
One technique for enhancing the signal from dilute solutions that should be universal is solvent removal, which has the effect of increasing the concentration of the solute. When the concentration of the solution is increased, more solute molecules are encountered by the probe laser beam, which increases the overall signal. To a first approximation the absolute signal will increase linearly with the concentration. This means, for example, that if a 2 µL droplet (diameter of 1.56 mm) evaporates to 100 µm diameter the concentration and therefore the signal intensity will increase by >3000 ×. Continual removal of solvent down to a 10 µm diameter droplet increases the concentration by a factor >3 × 10⁶ ×.
Although the potential signal enhancements are attractive and there are several well-known methods for solvent removal (see Box 1), each of them has drawbacks which severely limit their range of applicability. For example, simple drying on a surface is not straightforward. Consider drops of coffee accidentally spilled on a table. If left to evaporate they will form “coffee-ring” stains on the table, this is general for all solution drops placed on a standard flat surface and is caused by the pinning of the three-phase contact line of the drop that stops it contracting radially. This effect is coupled to internal flows within the evaporating droplet that cause the solute to be transported to the periphery, which enhances the pinning effect and eventually leads to formation of a ring deposit at the edge of the pinned droplet.1
Box 1. Solvent removal techniques and associated issues.
Levitation:2
|
Leidenfrost effect (film boiling):3
|
Microfluidics (water permeates into oil):4
|
Surfaces:5
|
If a deposited droplet could retain a near perfect spherical shape as solvent was removed the solute should then become confined to a single solid deposit at the central position of the deposited droplet, rather than a ring. This can be achieved with a suitable, highly water repellent surface.
Superhydrophobic surfaces
A superhydrophobic surface, is defined as one where a deposited droplet makes a contact angle (the angle between liquid–solid and liquid–air interfaces) >150°. Such surfaces have been observed for centuries since they are found in nature, the best known examples being Lotus leaves, which are seen to be very water repellent. However, it is only since 1997, when the properties of several hundred water repelling plants were investigated by electron microscopy that the link between the plant’s microstructure and their properties was established.6 In this study it was found that all water repellent plants shared two important characteristics. First, surface roughness; it was found that the best repellency was shown by plants that had roughness on multiple length scales. Second, the plants had a thin layer of a low surface energy wax which covered the roughness features. Mimicking these two properties is vital for the preparation of the very best artificial superhydrophobic surfaces.
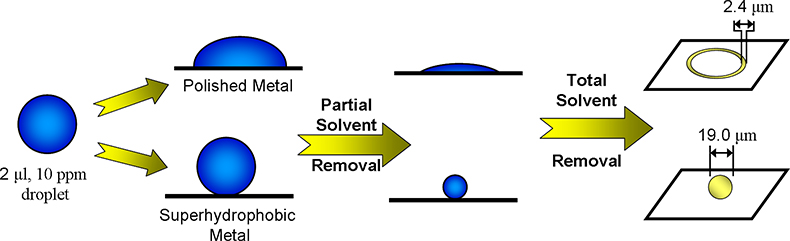
Figure 1. Evaporation of droplets of dipicolinic acid solution which were deposited on polished metal and superhydrophobic surfaces.
It is not just the contact angle of deposited drops that makes superhydrophobic surfaces so useful. Rather, it is the fact that the difference in contact angles between the situations when water is being added (advancing contact angle) and removed (receding contact angle) can be made very small. A small difference of the contact angles (the contact angle hysteresis) means that deposited drops have less tendency to pin to the surface, so that droplets will remain almost perfectly spherical as they shrink during evaporation. However, they will ultimately reach a point where the solutes reach saturation (typically after the drop has contracted very significantly), and this leads to deposition of the solid at the point where the droplet sits rather than at the perimeter of a pinned droplet. Figure 1 illustrates this difference for a solution of 2,6-pyridinedicarboxylic acid (dipicolinic acid), which is a marker for bacterial spores, including Bacillus anthracis (anthrax) and is therefore of considerable interest for anti-terrorism applications.7
The result in Figure 1 was obtained using an artificial superhydrophobic surface and indeed, since the electron micrographs of the Lotus plant were first reported there has been extensive effort to prepare artificial superhydrophobic surfaces.8 However, the vast majority of these preparation techniques involve either vacuum conditions or long timescales to achieve the required surface structure and low surface energy. In contrast, we have developed a method that can create superhydrophobic metal surfaces at the upper end of the scale, i.e. with contact angles approaching 180°9 but, unlike previous methods, these surfaces can be prepared within minutes at standard temperature and pressure.
Briefly, a base metal is immersed in a noble metal salt solution (normally silver or gold) for <1 minute. The reduction potentials are such that electroless Galvanic deposition occurs creating a hierarchical surface structure, Figure 2. Since it is a noble metal which is deposited, a self-assembled monolayer of low energy molecules can be formed on the textured surface simply by immersion in solutions of appropriate thiol compounds. This gives a surface with extreme superhydrophobicity and a measured contact angle of 173° ± 1°, see inset to Figure 2. In addition to the high contact angle, the prepared surfaces also showed a very low rolloff angle of 0.64° ± 0.14°. Therefore, deposited drops remain in a spherical shape as solvent is progressively removed.
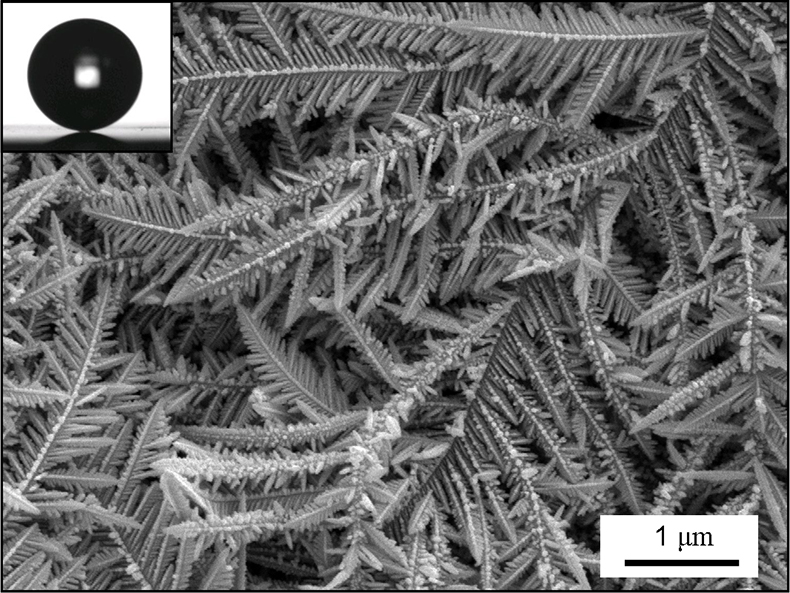
Figure 2. SEM of the hierarchical structures formed when silver is electrolessly deposited onto copper. Inset: Photograph of a water drop on the surface after a low energy monolayer has been formed.
Results
Figure 3 shows an array of 1 mM dipicolinic acid solution droplets placed on a superhydrophobic surface. The droplets need to be placed in shallow dimples in the substrate to prevent them rolling off while the solvent is being removed under gentle vacuum; for a 10 µL droplet this takes 12–15 minutes. The presence of the shallow depressions also ensures that the area which must be searched to locate the final solute deposit is minimised. Figure 3 also shows the spectrum of the deposit which was obtained in a standard “macro” Raman instrument (probe beam diameter ~100 µm) which compares closely to the spectrum of bulk dipicolinic acid. Importantly, there are no observable signals from the superhydrophobic surface itself.
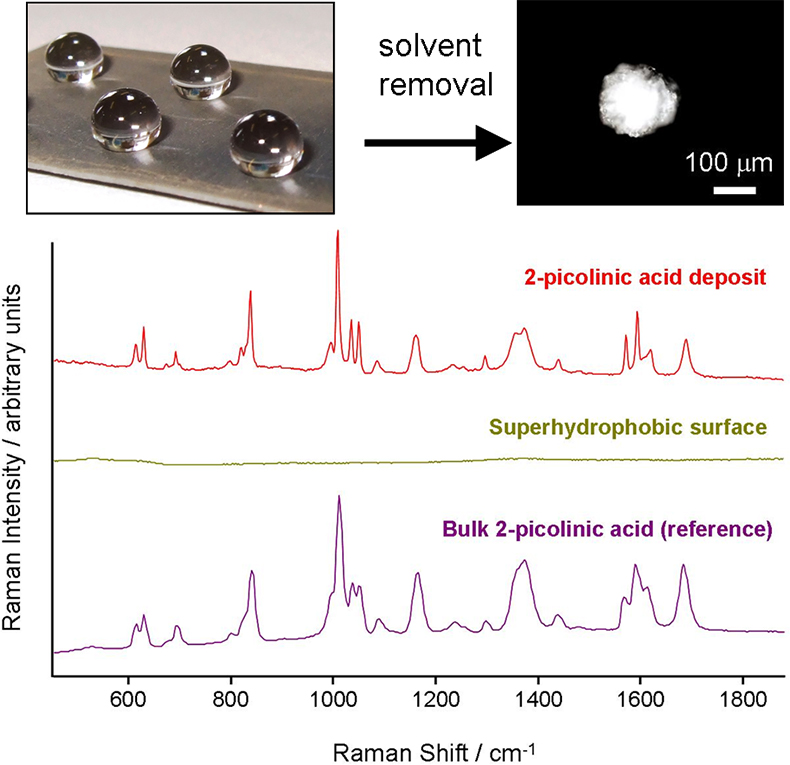
Figure 3. An array of droplets placed on a dimpled superhydrophobic surface. After solvent removal, small confined solute deposits of dipicolinic acid are formed. The spectrum of the deposit matches that of the bulk with no contribution from the superhydrophobic surface.
The photograph of the deposit in Figure 3 shows that it is quite large, >150 µm in diameter, even though it corresponds to 100 nanomoles of analyte. If the initial concentration of the solution is reduced the deposit is smaller but since the sample volume probed by confocal Raman microscopy is <1 µm in diameter there is clearly an opportunity to reduce the concentration by several orders of magnitude and still obtain deposits which can be probed in this way.
The utility of this technique is not confined to Raman spectroscopy, mass spectrometry is another analytical technique that could benefit from the use of symmetrical radial drying since again it should generally be found that the thicker the deposit the more solute should be desorbed and analysed (although this does also depend on other factors such as the characteristics of the desorption laser). Wei et al.10 found that they could obtain 10–50 × higher mass sensitivity using a hydrophobic surface (contact angle between 90° and 150°) but the improvement available using superhydrophobic surfaces is potentially much larger.
Conclusions
Unlike previous Raman enhancement techniques, solvent removal is applicable to all solutes in dilute aqueous solution. It does not depend on the correct electronic absorptions or charges as is the case for resonance and surface enhancements, respectively. It is possible to envision a method whereby the solution undergoes a bulk concentration step first before then being further concentrated using the technique described here. This should lead to even better signal improvements. The technique of solvent removal described here is a simple, straightforward method which does not rely on complex methodologies or expensive materials. The most important factor that has allowed this technique to be developed is the production of a superhydrophobic surface that is inexpensive and simple to prepare but prevents the formation of “coffeering” deposits. This technique is not limited to Raman spectroscopy but could also find use within mass spectrometry. It has potential to be used as a standard laboratory tool in a wide range of applications where low concentrations of target molecules are found in dilute aqueous solutions, these can run all the way from proteomics, where the concentrations are routinely small, through to defence applications where it is necessary to identify low concentrations of chemical and biological agents in aqueous samples.
Acknowledgements
IAL thanks DEL(NI) for a studentship.
References
- R.D. Deegan, O. Bakajin, T.F. Dupont, G. Huber, S.R. Nagel and T.A. Witten, Nature 389, 827–829 (1997). https://doi.org/10.1038/39827
- M. López-Pastor, A. Domínguez-Vidal, M.J. Ayora-Cañada, T. Laurell, M. Valcárcel and B. Lendl, Lab Chip 7, 126–132 (2007). https://doi.org/10.1039/B608618G
- T.Y. Xiong and M.C. Yuen, Int. J. Heat Mass Transfer 34, 1881–1894 (1991). https://doi.org/10.1016/0017-9310(91)90162-8
- M.Y. He, C.H. Sun and D.T. Chiu, Anal. Chem. 76, 1222–1227 (2004). https://doi.org/10.1021/ac035196a
- C. Ortiz, D.M. Zhang, Y. Xie, A.E. Ribbe and D. Ben-Amotz, Anal. Biochem. 353, 157–166 (2006). https://doi.org/10.1016/j.ab.2006.03.025
- W. Barthlott and C. Neinhuis, Planta 202, 1–8 (1997). https://doi.org/10.1007/s004250050096
- S.E.J. Bell, J.N. Mackle and N.M.S. Sirimuthu, Analyst 130, 545–549 (2005). https://doi.org/10.1039/B415290E
- P. Roach, N.J. Shirtcliffe and M.I. Newton, Soft Matter 4, 224–240 (2008). https://doi.org/10.1039/B712575P
- I.A. Larmour, S.E.J. Bell and G.C. Saunders, Angew. Chem. Int. Edit. 46, 1710–1712 (2007). https://doi.org/10.1002/anie.200604596
- H. Wei, S.L. Dean, M.C. Parkin, K. Nolkrantz, J.P. O’Callaghan and R.T. Kennedy, J. Mass Spectrom. 40, 1338–1346 (2005). https://doi.org/10.1002/jms.916