Maria C. Prieto Conaway,a Shousong Cao,b Farukh Durrani,b Youcef Rustum,b Ping Wang,c Khin Marlarc and Latif Kazimc
aThermo Fisher Scientific, San Jose, CA, USA
bRoswell Park Cancer Institute, Department of Cancer Biology, Buffalo, NY, USA
cRoswell Park Cancer Institute, Department of Cell Stress Biology, Buffalo, NY, USA
Introduction
The majority of diseases that lead to premature death in humans originate in tissue and cell dysfunction, due to either congenital or acquired genetic deficiency. Tissue imaging is a promising technique as it allows scientists to follow, among other things, distribution patterns derived from drug treatment (precursor drug and metabolites) in specific tissues or their distribution within, for example, a whole rat. One of the biggest problems in tissue imaging is the amount of background ”noise”, which can make it very difficult to identify the analyte of interest among all the other signals present. Tissue samples are extremely complex, with many different lipids, sugars, proteins and peptides overwhelming any trace analytes in a spectrum. This article discusses matrix-assisted laser desorption/ionisation (MALDI) enabled linear ion trap (LIT) mass spectrometry (MS) as a technique for fast and accurate tissue imaging, compared to the more traditional time-of-flight (ToF) method.
MALDI-enabled linear ion trap mass spectrometry
To date, ToF has been the mass spectrometry technique of choice for tissue imaging. However, this method is only capable of performing MS or MS2 detection. By using an ion trap, it is possible to isolate and detect analytes of interest more efficiently from tissue. The MALDI-enabled LIT mass spectrometer used in the study reported here consists of a set of quadrupoles that guide the ions into the ion trap, a LIT and two detectors. Coupled with specialised imaging visualisation software, the technique enables the visualisation of the spatial distribution of a particular analyte within sections of tissue samples, regardless of the chemical noise.
In a traditional tissue analysis, the sample is homogenised and the metabolites or analytes of interest are then extracted. In the process, analyte localisation within the tissue is lost. With direct tissue MALDI MS analysis, it not only becomes possible to identify whether a specific analyte is present in the sample, but a 2D image can also be generated, showing exactly where in the sample that analyte is. Tissue imaging by mass spectrometry distinguishes between, and provides distribution of, both parent drug and metabolites, something the most commonly used technique of Whole Body Quantitative Autoradiography cannot do. Two-dimensional or even three-dimensional maps of the mass spectrometric analysis can be created using imaging software.
An experiment was developed to demonstrate the tissue imaging capability of MALDI-enabled LIT MS. The study aimed to determine the metabolites of the anti-cancer drug irinotecan and their distribution in human tumour samples. The experiment was also designed to determine the effect on the metabolite profile of the drug methylselenocysteine (MSC), which is often co-administered with irinotecan as it enhances its activity.
Experimental
Irinotecan, originally isolated from the Chinese tree Camptotheca acuminate, has strong anti-tumour activity against a variety of human tumours. It works by binding to and preventing dissociation of the DNA topoisomerase I complex, which is involved in DNA replication. As a consequence, irinotecan inhibits enzyme activity and thus the DNA replication process.
Human head tumours and squamous cell carcinomas, which lack microvessels, offer resistance to irinotecan therapy. FaDu tumour xenografts with high vascular regions were analysed to investigate which regions of the tumours are accessible or inaccessible to irinotecan and establish whether MALDI MS-based imaging is a viable technique in cancer therapy research. The researchers attempted to locate the known metabolites of irinotecan within the tumour. The metabolic pathway and the major known metabolites are shown in Figure 1.
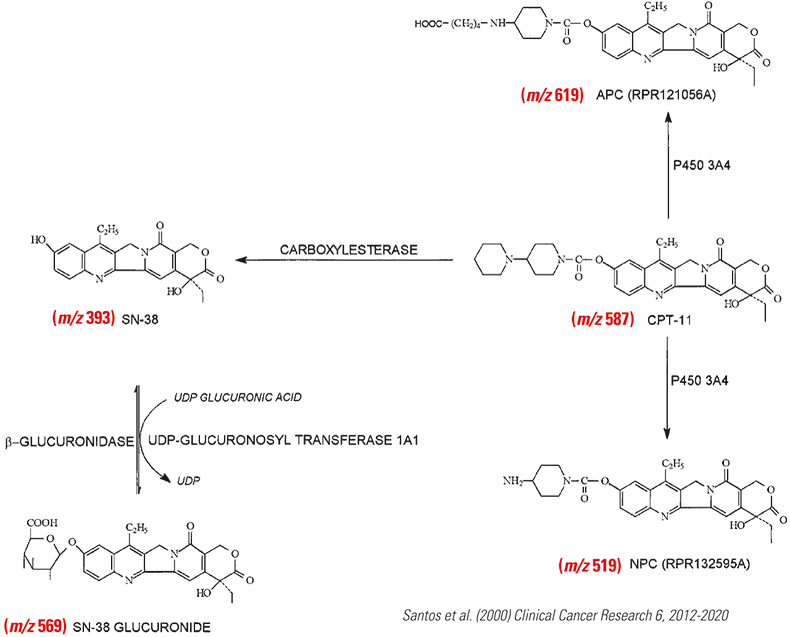
Figure 1. Metabolism of irinotecan extracted from human urine.
Nude mice with transplanted human FaDu head and neck tumours were treated with irinotecan, MSC, both drugs in combination or not treated at all. Oral doses of MSC, 0.2 mg/mouse/day, were administered for seven days. Following this, 100 mg kg–1 of irinotecan was given by intravenous injection to both MSC treated and untreated mice. The livers and tumours were then excised, flash frozen and stored at –80°C prior to analysis.
The frozen tumours and livers were sectioned to 12 µm thick and thaw-mounted onto non-conductive glass slides. The slides were placed under vacuum for about 15 min. Five additions of 0.1 µL of 6-aza-2-thiothymine (ATT) matrix were spotted on top of the tissue or sprayed using a commercial airbrush. The matrix solvent was 70/30 v/v methanol/0.1% trifluoroeacteic acid (TFA).
A Thermo Scientific LTQ XL™ mass spectrometer coupled to a MALDI source was used for imaging mass spectrometry, with data acquisition software to raster the tissue in the x and y directions. Data were analysed using the Thermo Scientific ImageQuest™ software to visualise the distribution of the drugs within the tumours. A 60 Hz nitrogen laser with beam diameter of ~100 µm impinged directly on to the MALDI plate at a 30° angle. Both ion activation techniques, namely collision induced-dissociation (CID) and pulsed Q dissociation (PQD), were employed. PQD effectively lowers the low mass range in LTQ ion traps to m/z 50.
Results and discussion
The MALDI fragmentation spectrum in Figure 2 shows all major irinotecan ion fragments as expected from electrospray ionisation and LC-MS published work.1
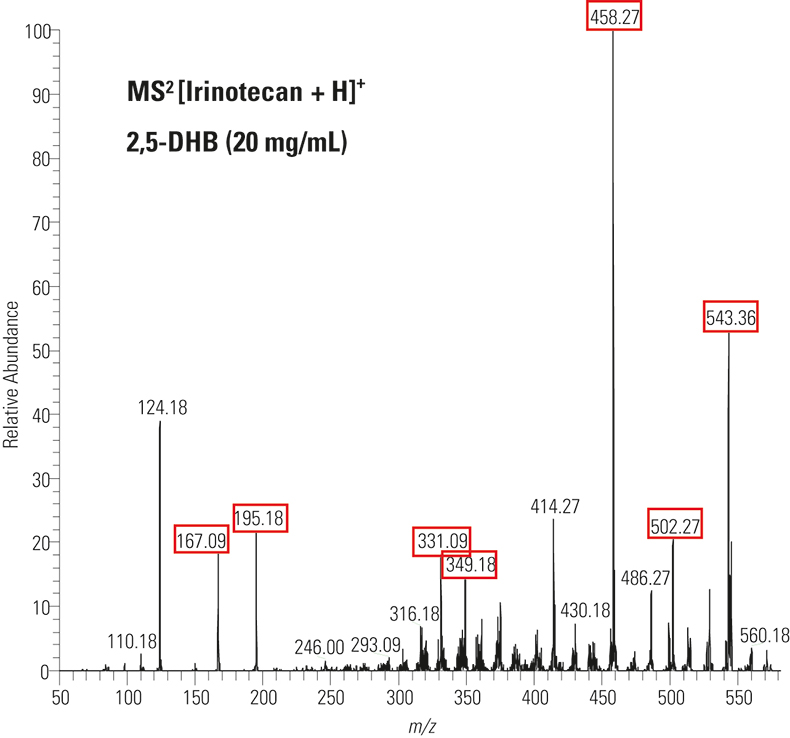
Figure 2. MALDI fragment ion spectrum of solution irinotecan by PQD of m/z 587. The expected fragment ions are highlighted in red.
Irinotecan metabolites that had been only previously identified in human urine were detected directly off tissue in all of the drug-treated samples from mice (irinotecan or combination irinotecan plus MSC) and none of the metabolites were detected in either the no-drug or the MSC-only control. SN-38 (m/z 393), SN-38G (m/z 569), isobaric M1 and/or M2 (m/z 603) and the parent drug irinotecan (m/z 587) were found. The MS2 of m/z 603 contained weak fragment ions at 518 (–85, loss of piperidine) and m/z 502 (–101, loss of oxidised piperidine), which implied that both M1 and M2 metabolites were present in tissue. However, the MS3 of m/z 518, which would confirm the presence of M1, was weak and not conclusive. The peak at m/z 603 appeared to be mostly M2 because of the prominent m/z 559 peak (–CO2). MS3 data confirmed this. The NPC metabolite (m/z 519), an indication of in vivo metabolised loss of a terminal piperidine, was not observed directly, although loss of piperidine was evident through CID in the ion trap.
Distributions of unmetabolised irinotecan were obtained in the liver and FaDu tumour by imaging mass spectrometry when ATT matrix was sprayed on the tissue. The parent drug was convincingly identified from the tissue, as were the metabolites SN-38-G and M2, by MS2 and MS3 in positive ion mode.
Figure 3 shows the distribution of two metabolites (SN-38 and its glucuronide form) in FaDu tumours treated with irinotecan alone and irinotecan plus MSC. This second drug has been shown to increase irinotecan efficacy against tumours and is more effective in highly vascularised tumours such as FaDu than in avascular tumors. Figure 3 clearly shows that m/z 349 (a fragment ion of SN-38 and SN-38-G) is more uniformly distributed in FaDu tumours that have been treated with both MSC and irinotecan than in those treated with irinotecan alone, where the analyte appears clumped in regions. More experiments are underway to relate these imaging results to previous observations that MSC appears to increase irinotecan efficiency against tumours, particularly in highly vascularised tumours such as FaDu.2
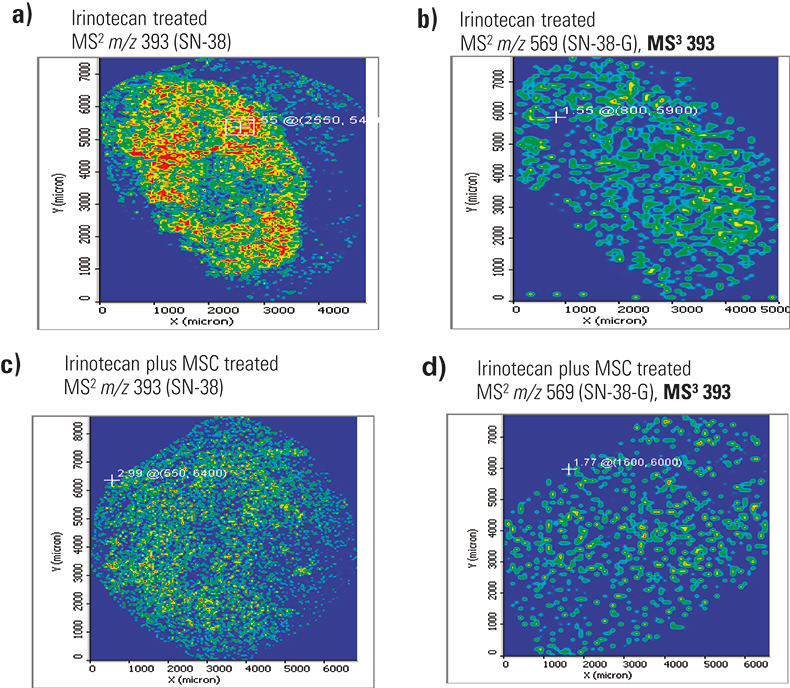
Figure 3. Distribution of m/z 349 fragment ion from fragmentation of SN-38 and SN-38-G metabolites in two FaDu tumour samples treated with either irinotecan (a and b) or irinotecan plus MSC (c and d). Figures a and c were acquired at 50 µm spatial resolution, while b and d were acquired at 100 µm resolution. The colour scale is highest intensity red > yellow > green, where blue means no analyte.
These results were consistent in three different tissue samples, two acquired at 100 µm resolution (MS/MS and MS3 data) and one at 50 µm resolution (MS2 only). This may indicate that coating variability during matrix application was not to blame. Results from the MS3 image were more specific and indicative of the metabolite, as controls showed some signal for MS2 of m/z 393.
Conclusion
Tissue imaging enables analysts to visualise drug and metabolite distributions directly off tissue. However, direct tissue analysis is challenging as tissues contain a variety of endogenous compounds at higher concentrations than the drug or metabolite of interest. MALDI-enabled LIT MS was able to identify and confirm most of the known drug metabolites in drug-treated tumour samples through MS2 and MS3. This is due to the ability of the MALDI LIT mass spectrometer to isolate the analyte of interest, accumulate ions in the ion trap and detect all ions trapped through radial ejection and use of two electron multiplier detectors. When combined with imaging visualisation software, the technique generates a 2D image showing the exact location of specific analytes in the sample. As opposed to ToF MS or MS2 detection, MALDI-enabled LIT MS enables MS3 fragmentation which is essential in tissue imaging to filter out interfering and isobaric species that are part of the baseline chemical noise and might be isolated during MS2.
References
- A. Santos, S. Zanetta, T. Cresteil, A. Deroussent, F. Pein, E. Raymond, L. Vernillet, M.-L. Risse, V. Boige, A. Gouyette and G. Vassa, “Metabolism of irinotecan by CYP3A4 and CYP3A5 in humans”, Clin. Cancer Res. 2012–2020 (2000).
- S. Cao, F.A. Durrani and Y.M. Rustum, “Selective modulation of the therapeutic efficacy of anticancer drugs by selenium containing compounds against human tumor xenografts”, Clin. Cancer Res. 2561–2569 (2004). https://doi.org/10.1158/1078-0432.CCR-03-0268