Ed McCurdy* and Don Potter
Agilent Technologies, Lakeside, Cheadle Royal Business Park, Stockport, Cheshire SK8 3GR, UK. E-mail: [email protected], [email protected]
Introduction
Ever since the development of inductively coupled plasma-mass spectrometry (ICP-MS) in the mid 1980s, there have been certain applications or specific analyses that have been regarded as difficult or impossible to address using the technique.
The determination of trace levels of certain elements in high matrix samples can be considered a “classical” difficult application and the assumption has been made that this is an inherent limitation of ICP-MS. In fact, many trace elements can be measured successfully at single µg L–1 concentrations in very high matrix levels (percent levels of chloride or sulphate), provided certain parameters relating to instrument design and operating conditions are addressed.
Matrix tolerance of ICP-MS
Inductively coupled plasma mass spectrometry is a powerful technique for the measurement of trace metals in a wide range of sample types. Virtually all elements can be measured, high sensitivity and low background signals combine to give very low detection limits (ng L–1 in most cases) and the rapid scanning quadrupole analyser means that measurement of a full suite of elements takes only about four minutes per sample. These factors have led to the widespread acceptance of ICP-MS in many application areas and most well-equipped trace metals laboratories would regard an ICP-MS as indispensable.
While ICP-MS is clearly enormously powerful, any analytical technique (ICP-MS included) has some limitations. Dissolved solids levels must be controlled carefully for ICP-MS analysis, typically no higher than 0.2 %, to avoid matrix deposition on the spectrometer interface. Compared to ICP-OES, ICP-MS has a limited capability in the determination of very high analyte concentrations (>100s mg L–1), although this has been addressed with new detector technology in the latest generation of instruments. Finally, one of the strengths of ICP-MS, its spectral simplicity, can work against it by making spectral overlaps more difficult to avoid.
The question of spectral overlaps has been discussed since the very first papers on ICP-MS were written. Even Gray’s 1975 paper on Direct Coupled Plasma Mass Spectrometry (DCP-MS), regarded by many as the inspiration for the development of ICP-MS, contains references to the appearance of undissociated molecular species in the mass spectrum.1 The key limitations of the DCP (low sensitivity for poorly-ionised elements and severe matrix effects) were related to its low temperature (about 5000 K), which is still relevant to modern ICP-MS instruments.
The early ICP-MS instruments operated at a much higher plasma temperature (around 7500 K) than the DCP, so many of these limitations were overcome,2 but reports of performance limitations of ICP-MS, due to high salt matrices or specific spectral overlaps, still appeared in the literature.3,4 These two papers identified two of the key performance parameters by which ICP-MS is still measured today:
- tolerance to high levels of easily ionised salt matrices and
- the formation of refractory oxide interferences, based on components of the sample matrix.
Factors affecting matrix tolerance and interference levels
A simplified diagram of the processes that occur as a sample aerosol droplet passes through the ICP is shown in Figure 1. It is important to note that the sample aerosol passes through the centre of the plasma, carried by the nebuliser or carrier gas flow. This gas flow “punches” through the centre of the plasma discharge and the transfer of energy to the sample aerosol is mainly by radiation from the hotter region of the plasma, located just inside the outer wall of the torch.
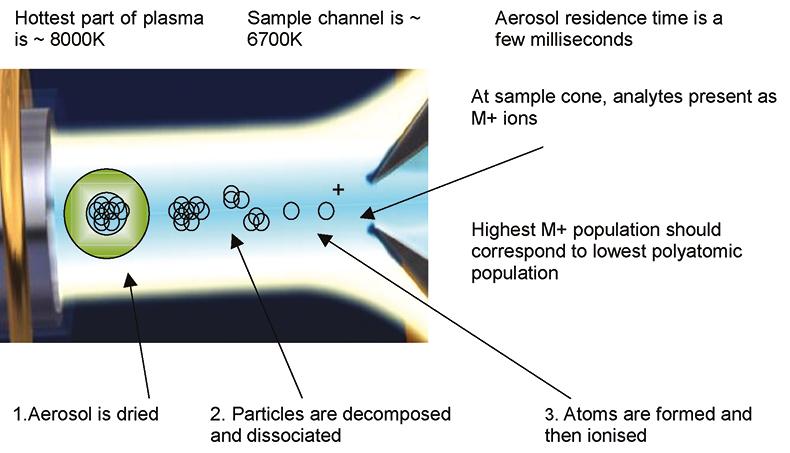
Figure 1. Schematic of plasma processes.
The sample aerosol is travelling very quickly through the plasma and has a residence time of only a few milliseconds. In this time, the plasma must dry, decompose, dissociate, atomise and ionise the sample to give, as far as possible, 100 % conversion of the sample analyte components into singly-charged positive ions. There are several factors that will affect the efficiency of this process and these factors will have a direct effect on the performance of the ICP-MS instrument. The key factors are plasma temperature, sample residence time, sample aerosol density and water vapour content of the sample aerosol.
Clearly, some of these parameters are under the control of the instrument operator and others are dependent on the design of the ICP-MS, but the fundamental requirement is for both hardware and optimisation that maintain a high plasma temperature. The influence of plasma temperature on sensitivity is highlighted in Table 1, which shows the degree of ionisation for a series of elements based on different plasma central channel temperatures. It is evident from the data that reducing plasma temperature can have a dramatic effect on the ionisation (and therefore sensitivity) of many elements, particularly those with high first ionisation temperatures.
Table 1. Ion population as a function of plasma temperature and ionisation potential, calculated using the Saha equation.
Element | Ip (eV) | Plasma temperature | |||
5000 K | 6000 K | 7000 K | 8000 K | ||
Cs | 3.89 | 99.4 % | 99.9 % | 100.0 % | 100.0 % |
Na | 5.14 | 90.0 % | 98.9 % | 99.8 % | 99.9 % |
Ba | 5.21 | 88.4 % | 98.7 % | 99.8 % | 99.9 % |
Li | 5.39 | 83.4 % | 98.2 % | 99.7 % | 99.9 % |
Sr | 5.69 | 71.5 % | 96.8 % | 99.5 % | 99.9 % |
Al | 5.98 | 56.2 % | 94.5 % | 99.1 % | 99.8 % |
Pb | 7.42 | 4.3 % | 51.2 % | 91.1 % | 98.3 % |
Mg | 7.64 | 2.6 % | 40.7 % | 87.7 % | 97.7 % |
Co | 7.86 | 1.6 % | 31.0 % | 83.2 % | 96.9 % |
Sb | 8.64 | 0.3 % | 9.0 % | 57.6 % | 90.9 % |
Cd | 8.99 | 0.1 % | 4.8 % | 43.2 % | 85.7 % |
Be | 9.32 | 0.1 % | 2.6 % | 30.6 % | 78.8 % |
Se | 9.75 | 0.0 % | 1.1 % | 17.8 % | 66.6 % |
As | 9.81 | 0.0 % | 1.0 % | 16.4 % | 64.6 % |
Hg | 10.43 | 0.0 % | 0.3 % | 6.5 % | 42.6 % |
Considering design first, there are four areas where performance can be influenced.
Plasma RF generator design
The RF generator frequency influences the efficiency of transfer of energy from the outer “skin” of the plasma to the central channel, through which the sample aerosol passes. Generators that operate at lower frequency have more efficient energy transfer than those that operate at higher frequency.5,6
Ion lens design
Improved ion transmission through the ion lens system allows the ICP-MS sample introduction design to be optimised for matrix tolerance, rather than maximum sensitivity.
Plasma torch design
A wide internal diameter (ID) torch injector will give a slower carrier gas velocity and a longer sample residence time, which gives an effective increase in plasma temperature. A wide ID injector also ensures a more diffuse sample aerosol, so improving drying and decomposition efficiency.
Spray chamber temperature control
Use of a Peltier device to cool the spray chamber to below 5 °C removes water vapour, reducing the solvent load on the plasma, leaving more energy available for matrix decomposition and analyte ionisation.7
Combined with these hardware design criteria are several optimisation parameters that influence the matrix decomposition and interference removal capability of the ICP. Again, the main aim of these optimisation parameters is to maintain a high temperature in the plasma central channel. The key parameters are:
- plasma RF forward power
- sampling depth
- carrier gas flow rate
- sample uptake rate.
Simple adjustment of all these parameters can be beneficial in improving performance and modern ICP-MS instruments allow computer control and auto-tuning, to ensure ease and consistency of set up.
Increasing the plasma RF forward power and the sampling depth will both contribute to an increase in effective plasma temperature. Reducing the carrier gas flow rate works in combination with a wide torch injector internal diameter, while a reduced sample uptake rate (typically <400 µL min–1) is particularly important as the sample matrix level is increased.
With all of these optimisation parameters, it is important to consider the impact of the optimisation on the other performance characteristics of the instrument, such that adequate sensitivity is maintained for the application being addressed.
The impact of adjusting one of these parameters (the sampling depth) is shown in Figure 2, which illustrates that an increase in sensitivity can easily be achieved by sampling at a shorter coil to sample cone distance, but at the expense of matrix tolerance, represented by the CeO/Ce ratio.
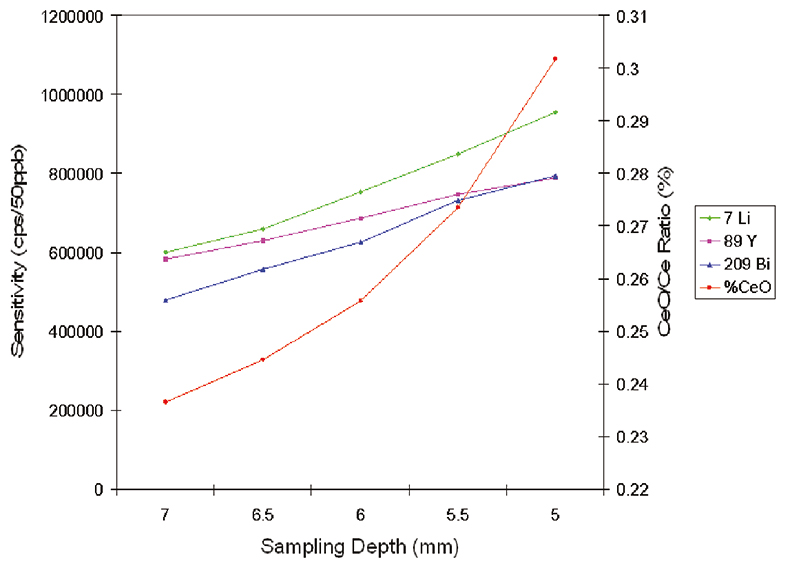
Figure 2. Influence of sampling depth on sensitivity and CeO/Ce ratio.
The CeO/Ce ratio is a plasma robustness criterion that has been widely adopted to monitor ICP-MS performance. This ratio indicates the efficiency with which the plasma can decompose the strong Ce–O bond and acts as an indicator for other matrix-based oxide interferences, such as those derived from calcium, silicon or magnesium in the sample. Furthermore, the CeO/Ce ratio acts as an indicator of general plasma performance, since a plasma that is unable to decompose CeO efficiently will have insufficient residual energy to ensure efficient ionisation of the elements with high first ionisation potentials. Finally, it has been found that improving the decomposition of CeO (reducing the CeO/Ce ratio) has the effect of reducing the magnitude of many other matrix interferences, such as those derived from chloride and sulphate.
On commercial ICP-MS instruments, reported CeO/Ce ratios vary between about 3 %8 and 0.3 %,9 the lower figure coming from systems for which matrix tolerance is a high priority.
Trace element analysis
There are three specific considerations in the analysis of trace elements in a high sample matrix. First, the presence of a matrix such as chloride or sulphate will lead to the formation of matrix-based polyatomic ions, for example 40Ar35Cl+, which overlaps As at mass 75. Several other possible polyatomic ions are shown in Table 2. The factors affecting the degree of formation of these polyatomic ions will be discussed in detail. Second, some trace elements, such as Be, As, Se, Cd and Hg, have a high first ionisation potential, so a low-temperature plasma will give a significantly reduced signal for these elements, as compared to a fully-ionised element such as Rh or In. A further consideration in the measurement of environmental or clinical samples is that such matrices often contain a high level of salts and other dissolved solids that will, on a poorly-designed and optimised system, overload the plasma and further reduce the overall sensitivity, particularly for poorly ionised elements. The presence of NaCl, in particular, will lead to reduced sensitivity, since sodium is very easily ionised and causes “ionisation suppression” of poorly-ionised elements such as As.
Table 2. Some potential overlaps derived from chloride and sulphate matrices.
Analyte | Isotope | Potential overlap |
Titanium | 47 | 35Cl12C |
Vanadium | 51 | 35Cl16O |
Chromium | 52 | 35Cl16O1H |
Chromium | 53 | 37Cl16O |
Manganese | 55 | 37Cl18O |
Iron | 57 | 40Ar16O1H |
Cobalt | 59 | 23Na35Cl1H |
Nickel | 60 | 23Na37Cl |
Copper | 65 | 32S32S1H, 32S16O21H |
Zinc | 66 | 32S34S, 35Cl16O14N1H |
Arsenic | 75 | 40Ar35Cl |
Selenium | 82 | 34S16O3 |
An overloaded plasma has a further impact on the long-term stability of the system, since undissociated matrix material may enter the spectrometer vacuum system and deposit on the ion lens components, causing drift. This will be particularly problematic when large interface cone orifices are used, as is common practice on systems with limited inherent sensitivity.
Performance for trace elements
To test the impact of an efficient plasma design in the determination of low levels of trace elements in the presence of a high matrix, a series of spiked standards was prepared. Each sample contained 10 µg L–1 of trace elements and the matrix varied from 0 mg L–1 to 10,000 mg L–1 (1.0 %) of either NaCl or H2SO4. The sample series was analysed on the Agilent 7500, under four different tuning conditions, optimised to give a range of different CeO/Ce ratios. Calibration was against simple aqueous standards and no blank subtraction or cone conditioning was performed. The results for As in the NaCl matrix are summarised in Figure 3, indicating that operation at 0.3 % CeO/Ce gave a significant reduction in the contribution of ArCl to mass 75. Indeed, the ArCl signal was reduced to such an extent that a simple elemental equation could be used to correct for the residual interference, allowing accurate quantitation of single µg L–1 As in a varying NaCl matrix. In the absence of effective matrix and interference decomposition in the plasma, indicated by the data series at 3.0 % CeO/Ce, a large error occurs in quantitation for As, equivalent to >250 % spike recovery of 10 µg L–1 As in 1 % NaCl. Figure 4 shows equivalent results for Zn in the presence of a variable sulphate matrix, again indicating that reducing the CeO/Ce ratio has a dramatic impact on the detection of trace levels of Zn. Failure to reduce the sulphur-based interferences leads, in the case of Zn, to a spike recovery of >270 % for 10 µg L–1 Zn in a matrix of 1 % H2SO4, clearly unacceptable for routine analysis.
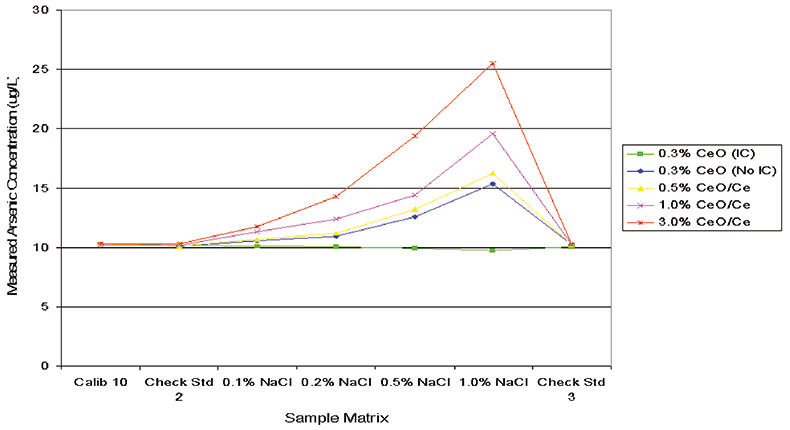
Figure 3. Influence of CeO/Ce ratio on ArCl interference on As at mass 75.
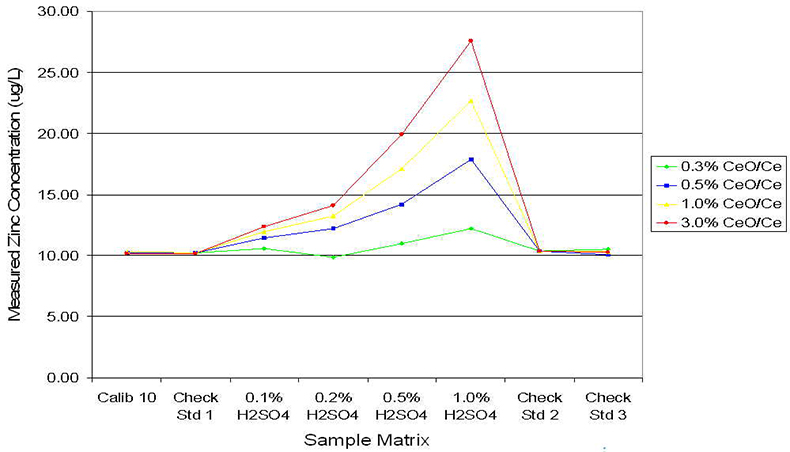
Figure 4. Influence of CeO/Ce ratio on S2 and SO2 interferences on Zn at mass 66.
Performance for As in aqua regia
In a practical application, As was determined in a series of soil samples prepared using an aqua regia digestion. In addition to resulting in a high and variable dissolved solids load (nominally 0.2 % or 2000 mg L–1), this sample preparation gave a final acid matrix of 1.4 % HNO3 and 4.2 % HCl. A series of As calibration standards was prepared in this acid matrix and the calibration plot generated is shown in Figure 5. Excellent precision and linearity were achieved, despite the very high chloride levels present. In addition, the blank count rate for ArCl was only 3000 cps (equivalent to <3 µg L–1 As) at a HCl concentration of 1 %, without any blank subtraction or interference correction. This low level of ArCl interference can be compared with the ArCl background of 20,000 cps for a chloride concentration of only 600 mg L–1 (0.06 %), reported from a system optimised at 3 % CeO,10 which illustrates the reduction in matrix interference levels that can be achieved by optimisation for a low CeO level.
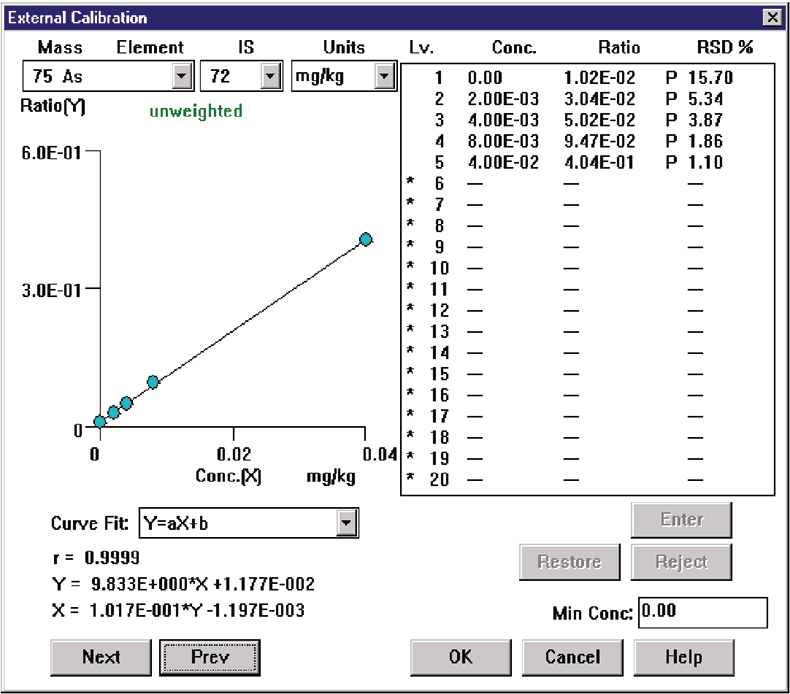
Figure 5. Calibration for As in 5.6 % aqua regia matrix (4.2 % HCl).
Summary
The determination of trace levels of many elements in environmental and clinical samples has often been presented as an insurmountable problem for ICP-MS, due to the potential for the formation of polyatomic interferences from matrix components. However, the magnitude of these matrix interferences is strongly influenced by the design and operating conditions of the ICP-MS sample introduction and plasma.
With an ICP-MS designed for matrix tolerance and using operating conditions that are optimised for efficient matrix decomposition, the influence of the overlaps can be minimised. This allows accurate determination of many trace elements at the single µg L–1 levels commonly found in natural materials. For more demanding applications, such as analysis of transition metals at ambient levels in seawater, a range of alternative options are available, such as hydride generation, matrix elimination and interference removal using collision/reaction cell (CRC) technology.
References
- A.L. Gray, Analyst 100, 289 (1975).
- R.S. Houk, V.A. Fassel, H.J. Svec, A.L. Gray and C.E. Taylor, Anal. Chem. 52, 2283 (1980).
- J.A. Olivares and R.S. Houk, Anal. Chem. 58, 20 (1986).
- A.L. Gray, Spectrochim. Acta 408, 1525 (1985).
- M.H. Abdalla, R. Diemiastzonek, J. Jarosz, J.-M. Mermet and J. Robin, Anal. Chim. Acta 33B, 55 (1978).
- P.E. Walters, W.H. Gunter and P.B. Zeeman, Spectrochim. Acta 41B, 133 (1983).
- R.C. Hutton and A.N. Eaton, J. Anal. At. Spectrom. 2, 595 (1987).
- J.W. Tromp, R.T. Tremblay, J.-M. Mermet, and E.D. Salin, J. Anal. At. Spectrom. 15, 617 (2000).
- J.L.M. De Boer, in Plasma Source Mass Spectrometry, Ed by G. Holland and S.D. Tanner. Royal Society of Chemistry, Cambridge, p. 27 (1999).
- U. Vollkopf, V. Baranov and S. Tanner, in Plasma Source Mass Spectrometry, Ed by G. Holland and S.D. Tanner. Royal Society of Chemistry, Cambridge, p. 63 (1999).