L. Rello,a E. García-Ruiz,b M.A. Belarrab and M. Resanob*
aDepartment of Clinical Biochemistry, “Miguel Servet” Universitary Hospital, Paseo Isabel La Católica 1–3, 50009 Zaragoza, Spain
bDepartment of Analytical Chemistry, University of Zaragoza, Pedro Cerbuna 12, 50009 Zaragoza, Spain. E-mail: [email protected]
Introduction
Eliminating childhood lead poisoning: a worldwide concern
Lead exposure is an international issue. Pb may enter biological systems (as Pb2+) via food (e.g. food contaminated from cans containing Pb solders in the joints), water (e.g. use of lead pipes), air and soil (the combustions of leaded fuels have contributed to the accumulation of atmospheric and soil Pb). In the USA, the major source of ingestion in young children seems to be the dust and chips originating from old lead paint (used from 1884 to 1978).1 Foetuses and very young children (up to 36 months of age) are more sensitive than adults to relatively high blood lead levels because their brains and nervous systems are still developing and their blood-brain barrier is still incomplete. Childhood lead exposure has been correlated with school absenteeism, low class ranks, poorer vocabulary, longer reaction times and diminished hand-eye coordination, among other neurobehavioural disorders.1
The level of public awareness on lead exposure in children may be summarised with the following recommendation for the US government included in the 2005 Policy Statement of the American Academy of Pediatrics (AAP): “Identify all children with excess lead exposure and prevent further exposure to them”.1 The threshold limit of lead poisoning in children has been established by the Centers for Disease Control and Prevention (CDCP) as 100 µg Pb L–1. In this context, the development of a fast, reliable and cost-efficient procedure for Pb control in those areas of risk can be considered of the upmost importance.
Blood collected onto filter paper: a procedure especially suited to young infants
Dried blood spot specimens are clinical specimens collected by carefully applying a few drops of blood, freshly drawn by finger or heel stick with a lancet, onto specially manufactured absorbent specimen collection (filter) paper, as illustrated in Figure 1. The no. 903® paper is a Food and Drug Administration (FDA)-registered in vitro Class II medical device used in virtually all US newborn screening programmes and in most newborn screening programmes throughout the world. Since it is a medical device, 903® paper must be manufactured and tested according to FDA Quality System Regulations and must meet some stringent requirements. These critical parameters for newborn screening sample collection are blood absorbency, serum uptake and circle size for a specified volume of blood.2 The filter paper (FP) blood collection device has achieved the same level of precision and reproducibility that analytical scientists and clinicians have come to expect from standard methods of collecting blood, such as vacuum tubes and capillary pipettes.3
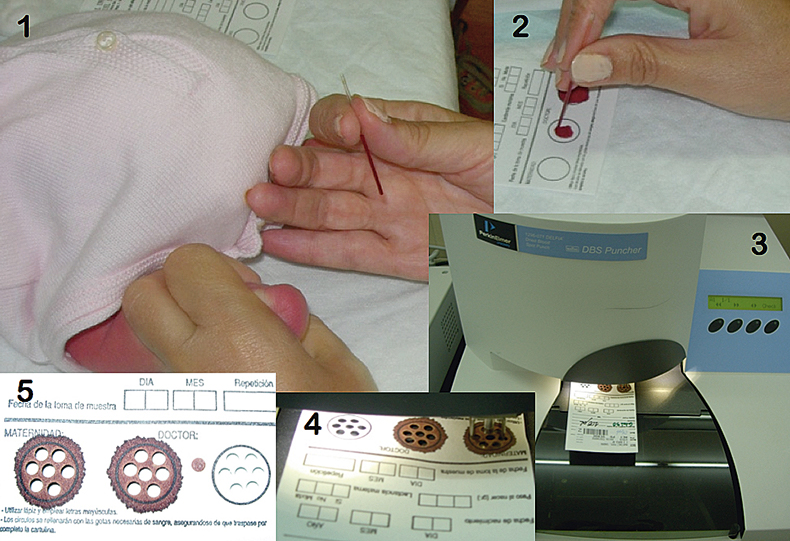
Figure 1. Different steps for sample preparation for the FP-SS-GFAAS approach investigated in this work. (1) Collection of blood from the heel of a child with a capillary. The infant’s heel was previously punctured with a sterile lancet. (2) Deposition of blood onto a FP. (3) Picture of an automated puncher. (4) Detail of the process of punching. (5) Three FP spots, with and without sample, after punching out seven of the 3.2 mm Ø discs used for GFAAS analysis from each of them. Modified from Reference 7. Reproduced by permission of the Royal Society of Chemistry.
The collection of blood onto paper has become a significant tool for screening individuals for clinical purposes and for carrying out epidemiological studies for the detection of numerous biological markers.3 This method is especially suitable for young infants because a small amount of blood is required, is generally easier and less traumatic to children, can be performed by a relatively untrained collector, and appropriately prepared FP specimens are stable and can be easily transported to the laboratory. In fact, FP-specimens can be mailed inside an envelope. Therefore, the use of this sampling procedure for Pb determination may bring about some relevant advantages in terms of simplicity and potential for sampling large areas at risks in a cost-efficient way.4
Solid sampling as an alternative tool for screening methods
Regardless of the suitability of the filter paper approach, it is necessary to consider that many analytical techniques were originally designed for the analysis of solutions only. Thus, when the target sample is a solid, a dissolution step is often required. This aspect can critically affect the ultimate performance of any procedure, in particular for Pb determination, as it represents a decrease in the sample throughput while considerably increasing the risk of suffering from contamination issues. Alternatively, the development of a direct solid sampling is a more appealing approach, in better agreement with the idea of a fast screening method. Several analytical techniques could be used for this purpose.5 Among them, solid sampling-graphite furnace atomic absorption spectrometry (SS-GFAAS) can be considered as the most promising one for this particular application, as it is inexpensive, requires almost no sample preparation, provides a high sensitivity and exhibits a good potential to deal with biological samples. Thus, this article discusses the possibilities of a procedure based on the collection of blood onto a clinical filter paper specimen, followed by direct solid sampling analysis of the resulting spots by means of SS-GFAAS, for the determination of the Pb content in blood.
Procedure for lead determination in dried blood spots by SS-GFAAS
Methodology
Capillary finger or heel blood was collected by trained nurses according to the document LA4-A4 by the National Committee for Clinical Laboratory Standards (NCCLS)2 and deposited on the 903Ò Filter Paper. Once air-dried, the filter paper was punched with an automated puncher (see Figure 1). Seven 3.2 mm diameter discs were easily punched out from every spot of blood. For comparative purposes, paired venous blood samples were taken using a standard phlebotomy technique and blood lead levels were analysed following the standard procedure (venous sampling, blood dilution and GFAAS monitoring).
The measurements of blood lead in dried blood spots were carried out using an AAS 5 EA atomic absorption spectrometer from Analytik Jena AG (Jena, Germany). This instrument is equipped with a transversely heated graphite tube atomiser, an automatic solid sampling accessory SSA 51 (including a Sartorius M2P, Göttingen, Germany, microbalance with a precision of 0.001 mg) and a Deuterium continuum source background correction system. Pyrolytic graphite tubes for solid sampling (without dosing hole) were used with this instrument. The samples were introduced using solid sampling platforms. More details on the design of this instrument can be found elsewhere.6
The solid sampling device used allows for automatic weighing (when necessary) and transporting of the sample discs into the furnace onto a graphite platform, using a pair of tweezers.6 In this case, 10 µL of the modifier solution (Pt, 5 mg L–1) were dispensed onto the platform with a micropipette. The sample disc was placed onto it, pressing slightly to get an intimate contact between the filter and the solution. Then, the platform containing the sample and the modifier was transferred into the graphite furnace and subsequently subjected to the temperature programme. All these operations were fully controlled from a keyboard, except for the deposition of the dried blood spot disc and the modifier onto the platform, which were carried out manually. The operating conditions used are summarised in Table 1. After sample atomisation, a small compact carbonaceous residue remains on the platform (see Figure 2). This residue is easily withdrawn with a needle.
Table 1. Instrumental parameters used in the determination of Pb in dried blood spots.
Wavelength (nm) | 217.0 |
Spectral band pass (nm) | 0.5 |
Ar gas flow during atomisation (mL min–1) | 0a |
Background correction | D2 |
Chemical modifier | 50 ng Pt |
Sample mass (mg) | 3.2 mm Æ FP Disc (»1.5 mg) embedded in blood (»0.8 mg) |
Temperature programme | Temperature / Ramp / Hold time |
Drying step | 200°C / 7° s–1 / 35 s |
Pyrolysis step | 800°C / 100° s–1 / 30 s |
Autozero step | 800°C / 0° s–1 / 4 s |
Atomisation step | 2000°C / 2000° s–1 / 5 s |
Cleaning step | 2500°C / 1000° s–1 / 3 s |
aLinearity up to 450 µg L–1. The use of mini-flow (0.1 L min–1) could be used to further expand the linear range up to 840 µg L–1.
Reproduced by permission of the Royal Society of Chemistry (see Reference 7).
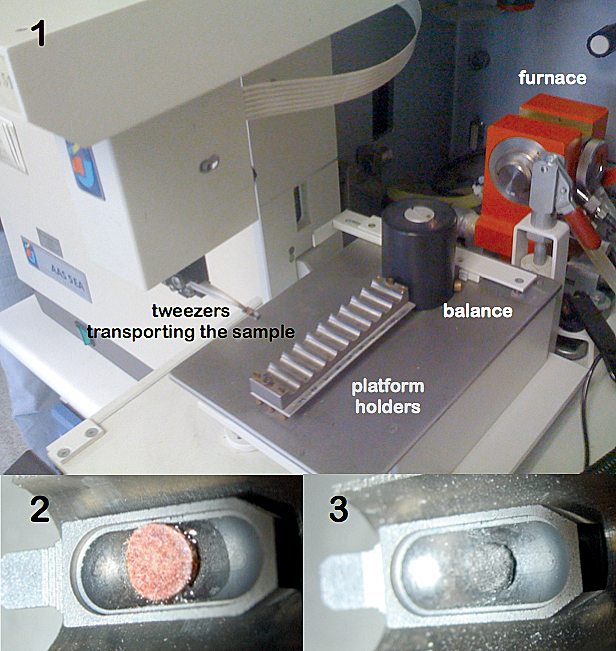
Figure 2. Different steps for Pb determination in blood from dried blood spots by FP-SS-GFAAS. (1) Solid Sampling device including a sample tray, a pair of tweezers and a microbalance. The tweezers are transporting the sample towards the furnace. (2) Detail of the platform containing the blood spot together with the modifier solution. (3) Carbonaceous residue left after carrying out the temperature programme.
Five replicate measurements (representing approximately 10 minutes’ work) were carried out for each determination and the median was taken as the representative value, in order to minimise the possible influence of outliers.5 Integrated absorbance (QA) was selected as the measurement mode in all cases.
Calibration was carried out against matrix-matched standards prepared by addition of very small quantities (in order to minimise the modification of the blood matrix) of lead solution to venous lead-free blood samples. Suitable volumes of these standards were applied onto the filter paper sheets and processed in the same way as the samples.
Selection of analytical parameters
Two main atomic analytical lines are available for Pb monitoring. The most sensitive Pb atomic line, 217.0 nm, was selected taking into account the small amount of blood deposited in every individual disc punched out from the filter paper. Since Pb is a volatile element and the goal of our work was to use a pyrolysis temperature high enough to remove most organic matrix components, in an attempt to minimise the background (BG), it was thus necessary to use a chemical modifier capable of stabilising the analyte. In this regard, platinum provided a satisfactory performance. Use of Pt leads to the sharpest peak profile, which should result in a better signal-to-noise ratio and to shorter integration times (2.5 s are enough), which is preferable since it reduces the overlap with the BG signal (see Figure 3). The amount of modifier should be adequate for the Pb concentration range expected; avoiding the use of very high amounts that could lead to overstabilisation issues (e.g. delayed signal, excessive tailing etc.). The range between 10 ng and 50 ng of Pt was found as optimum for the expected Pb level in blood (from tens to hundreds of µg L–1).
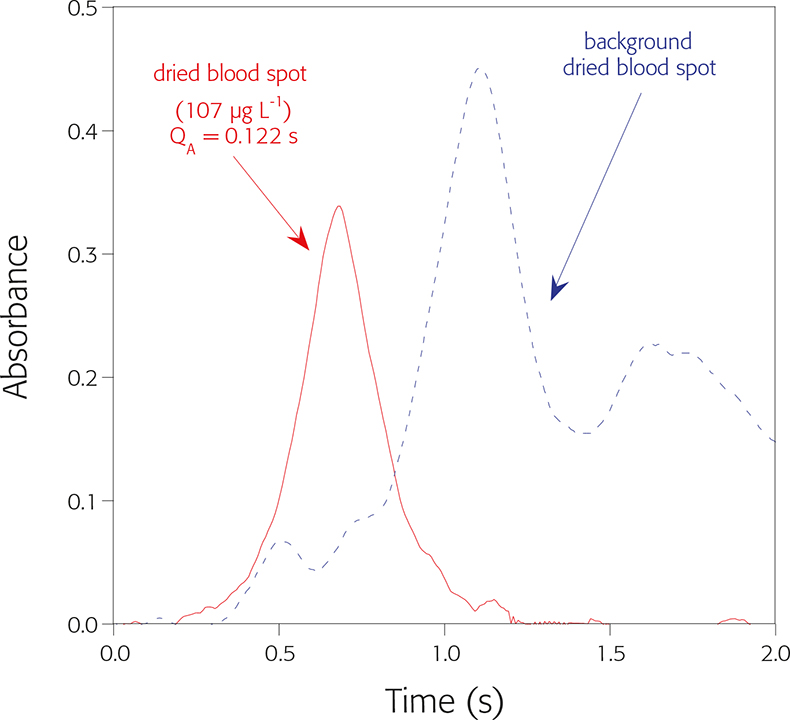
Figure 3. Signal profile obtained for Pb from dried blood spot using the temperature programme detailed in Table 1.
A pyrolysis temperature in the range 700–800°C is required. The use of lower temperatures is not sufficient to remove most of the matrix, giving rise to very high BG levels and hardly reproducible Pb signals. Pb losses occur at pyrolysis temperatures higher than 800ºC, although this temperature seems to be enough for the vaporisation of most of the matrix, as observed by smoke coming out of the tube. As for the atomisation temperatures, it is possible to atomise Pb from 1100ºC upwards, but the signals are poorly defined, showing excessive tailing. The signals are best defined for atomisation temperatures from 1900ºC or greater. The conditions finally selected are shown in Table 1.
Results
Under optimum analytical conditions, it was possible to obtain reproducible, well-defined analytical signals from the real samples, which were comparable with those obtained for the matrix-matched standards prepared as described in the Methodology section. The main analytical features of the method proposed are: a detection limit of 2.5 µg Pb L–1, a working range up to 840 µg Pb L–1 (up to 450 µg Pb L–1 using stopped flow conditions; maintaining minimum Ar flow (0.1 L min–1) during atomisation represents a three-fold loss in sensitivity and permits expanding the range at least up to 837 µg L–1), a sample throughput of approximately 10 minutes per sample (five replicates) and precision values below 10% RSD. The sensitivity obtained after calibration with matrix-matched standards with several sets of samples ranged from 0.00092 to 0.00101 s L µg–1. More details on this procedure can be found elsewhere.7
Finally, the performance of the whole FP-SS-GFAAS methodology was compared with the widely established venous blood analysis by dilution-GFAAS.8 The results of this comparison are plotted in Figure 4. The linearity of the regression curve as well as the value obtained for Pearson’s correlation coefficient indicate that a very good agreement between both methods was achieved.
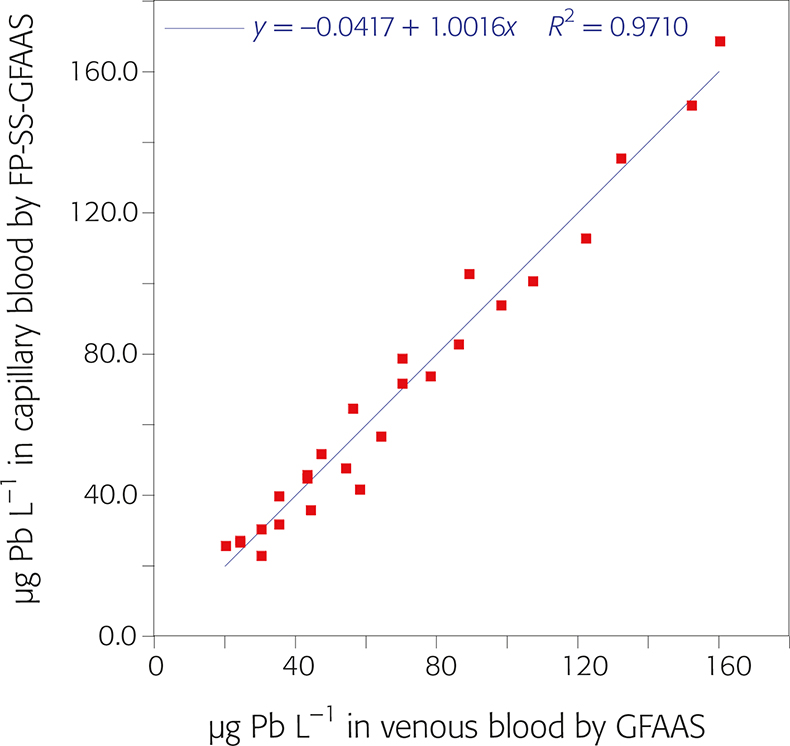
Figure 4. Linear least squares regression analysis of blood lead contents obtained for paired samples from 25 patients using two methodologies: FP-SS-GFAAS (y-axis) vs analysis of venous samples by solution GFAAS (x-axis).
Conclusion
In spite of worldwide concern on childhood lead poisoning and measures adopted to prevent its introduction in the environment, present blood lead levels in some countries make it advisable to implement a screening method, as recommended by the American Academy of Pediatrics. As dried blood spots have become a clinical specimen especially appropriate to collecting blood from young infants and due to the ease of transporting and storing, the direct monitoring of lead concentration from dried blood spots by SS-GFAAS should be of interest for this purpose.
References
- American Academy of Pediatrics, Committee on Enviromental Health, “Lead Exposure in Children: Prevention, Detection and Management”, Pediatrics 116, 1036–1046 (2005). https://doi.org/10.1542/peds.2005-1947.
- W.H. Hannon, C.M. Baily, L.E. Bartoshesky, B. Davin, G.L. Hoffman, P.P. King, S.S. Neier, J.A. Peter and B.L. Therrell, Blood Collection on Filter Paper for Newborn Screening Programs; Approved Standard—Fourth Edition. NCCLS document LA4-A4 (ISBN 1-56238-503-8), NCCLS, 940 West Valley Road, Suite 1400, Wayne, PA 19087-1898, USA (2003).
- J.V. Mei, J.R. Alexander, B.W. Adam and W.H. Hannon, J. Nutr. 131, 1631–1636S (2001). https://doi.org/10.1093/jn/131.5.1631S.
- N.V. Stanton, J.M. Maney and R. Jones, Clin. Chem. 45, 2229–2235 (1999).
- M.A. Belarra, M. Resano, F. Vanhaecke and L. Moens, Trends Anal. Chem. 21, 828–839 (2002). https://doi.org/10.1016/S0165-9936(02)01206-2.
- K.C. Friese and V. Krivan, Spectrochim. Acta Part B 53, 1069–1078 (1998). https://doi.org/10.1016/S0584-8547(98)00172-4.
- M. Resano, L. Rello, E. García-Ruiz and M.A. Belarra, J. Anal. At. Spectrom. 22, 1250–1259 (2007). https://doi.org/10.1039/b706913h.
- P.J. Parsons, J.J. Chisolm, H.T. Delves, R. Griffin, E.W. Gunter, W. Slavin, N.V. Stanton and R. Vocke, Analytical Procedures for the Determination of Lead in Blood and Urine; Approved Guideline. NCCLS document C40-A (ISBN 1-56238-437-6), NCCLS, 940 West Valley Road, Suite 1400, Wayne, PA 19087-1898, USA (2001).